
Wellbeing of Wales 2026 - A healthier Wales
A summary of progress on improving our social, economic, environmental and cultural wellbeing.
In this page
The goal for a healthier Wales
A society in which people’s physical and mental wellbeing is maximised and in which choices and behaviours that benefit future health are understood.
Progress towards the goal
Limited progress has been achieved towards a healthier Wales, with many national indicators deteriorating and the coronavirus (COVID-19) pandemic still affecting trends.
Healthy life expectancy at birth (the average time an individual is expected to live in good or very good health) continues to decline for both females and males. This is despite recent improvements to overall life expectancy at birth. The gap in healthy life expectancy at birth between the most and least deprived areas also continues to widen, with the gap now at its widest for males in the latest data for the period 2022 to 2024. On average, men in the most deprived areas of Wales can expect to live 18.1 fewer years in good or very good health compared with men in the least deprived areas.
The proportion of single babies born with low birthweight, under 2,500g, has shown an increase in the last decade, and was at 6.0% in the latest period.
The percentage of adults with 2 or more healthy lifestyle behaviours, such as not smoking, drinking within guidelines, eating fruit and vegetables, being physically active, and maintaining a healthy weight, declined between financial years 2016 to 2020. Since 2020 to 2021, the trend appears to have improved slightly, though changes in methods limit comparability across the full time series.
Among young people, the percentage with 2 or more healthy lifestyle behaviours has improved since 2017.
Adult mental wellbeing scores and the gap between the most and least deprived were stable between financial years 2016 to 2019. Since 2021 to 2022, the trend also appears to have remained stable, though changes in methods limit comparability across the full time series.
For young people, average mental wellbeing scores declined across the time series, with the gap between low and high family affluence widening.
Housing conditions have improved across all housing types, with 82% of all dwellings free from serious hazards in 2017 to 2018, up from 71% in 2008.
Life expectancy
Life expectancy had been rising since World War II, but has slowed in the past decade.
Main contributors to past improvements were for people aged 60 to 84, though gains in this group have now slowed.
In 2022 to 2024, life expectancy at birth increased compared with 2021 to 2023, rising to 82.2 years for females and 78.3 years for males, returning to pre- COVID-19 pandemic levels in 2017 to 2019.
Healthy life expectancy at birth in the same period decreased to 58.5 years for females and 59.2 years for males, falling for the fourth consecutive period for both women and men.
Figure 3.1: life expectancy and healthy life expectancy at birth, by sex, 2001 to 2024 [Note 1]
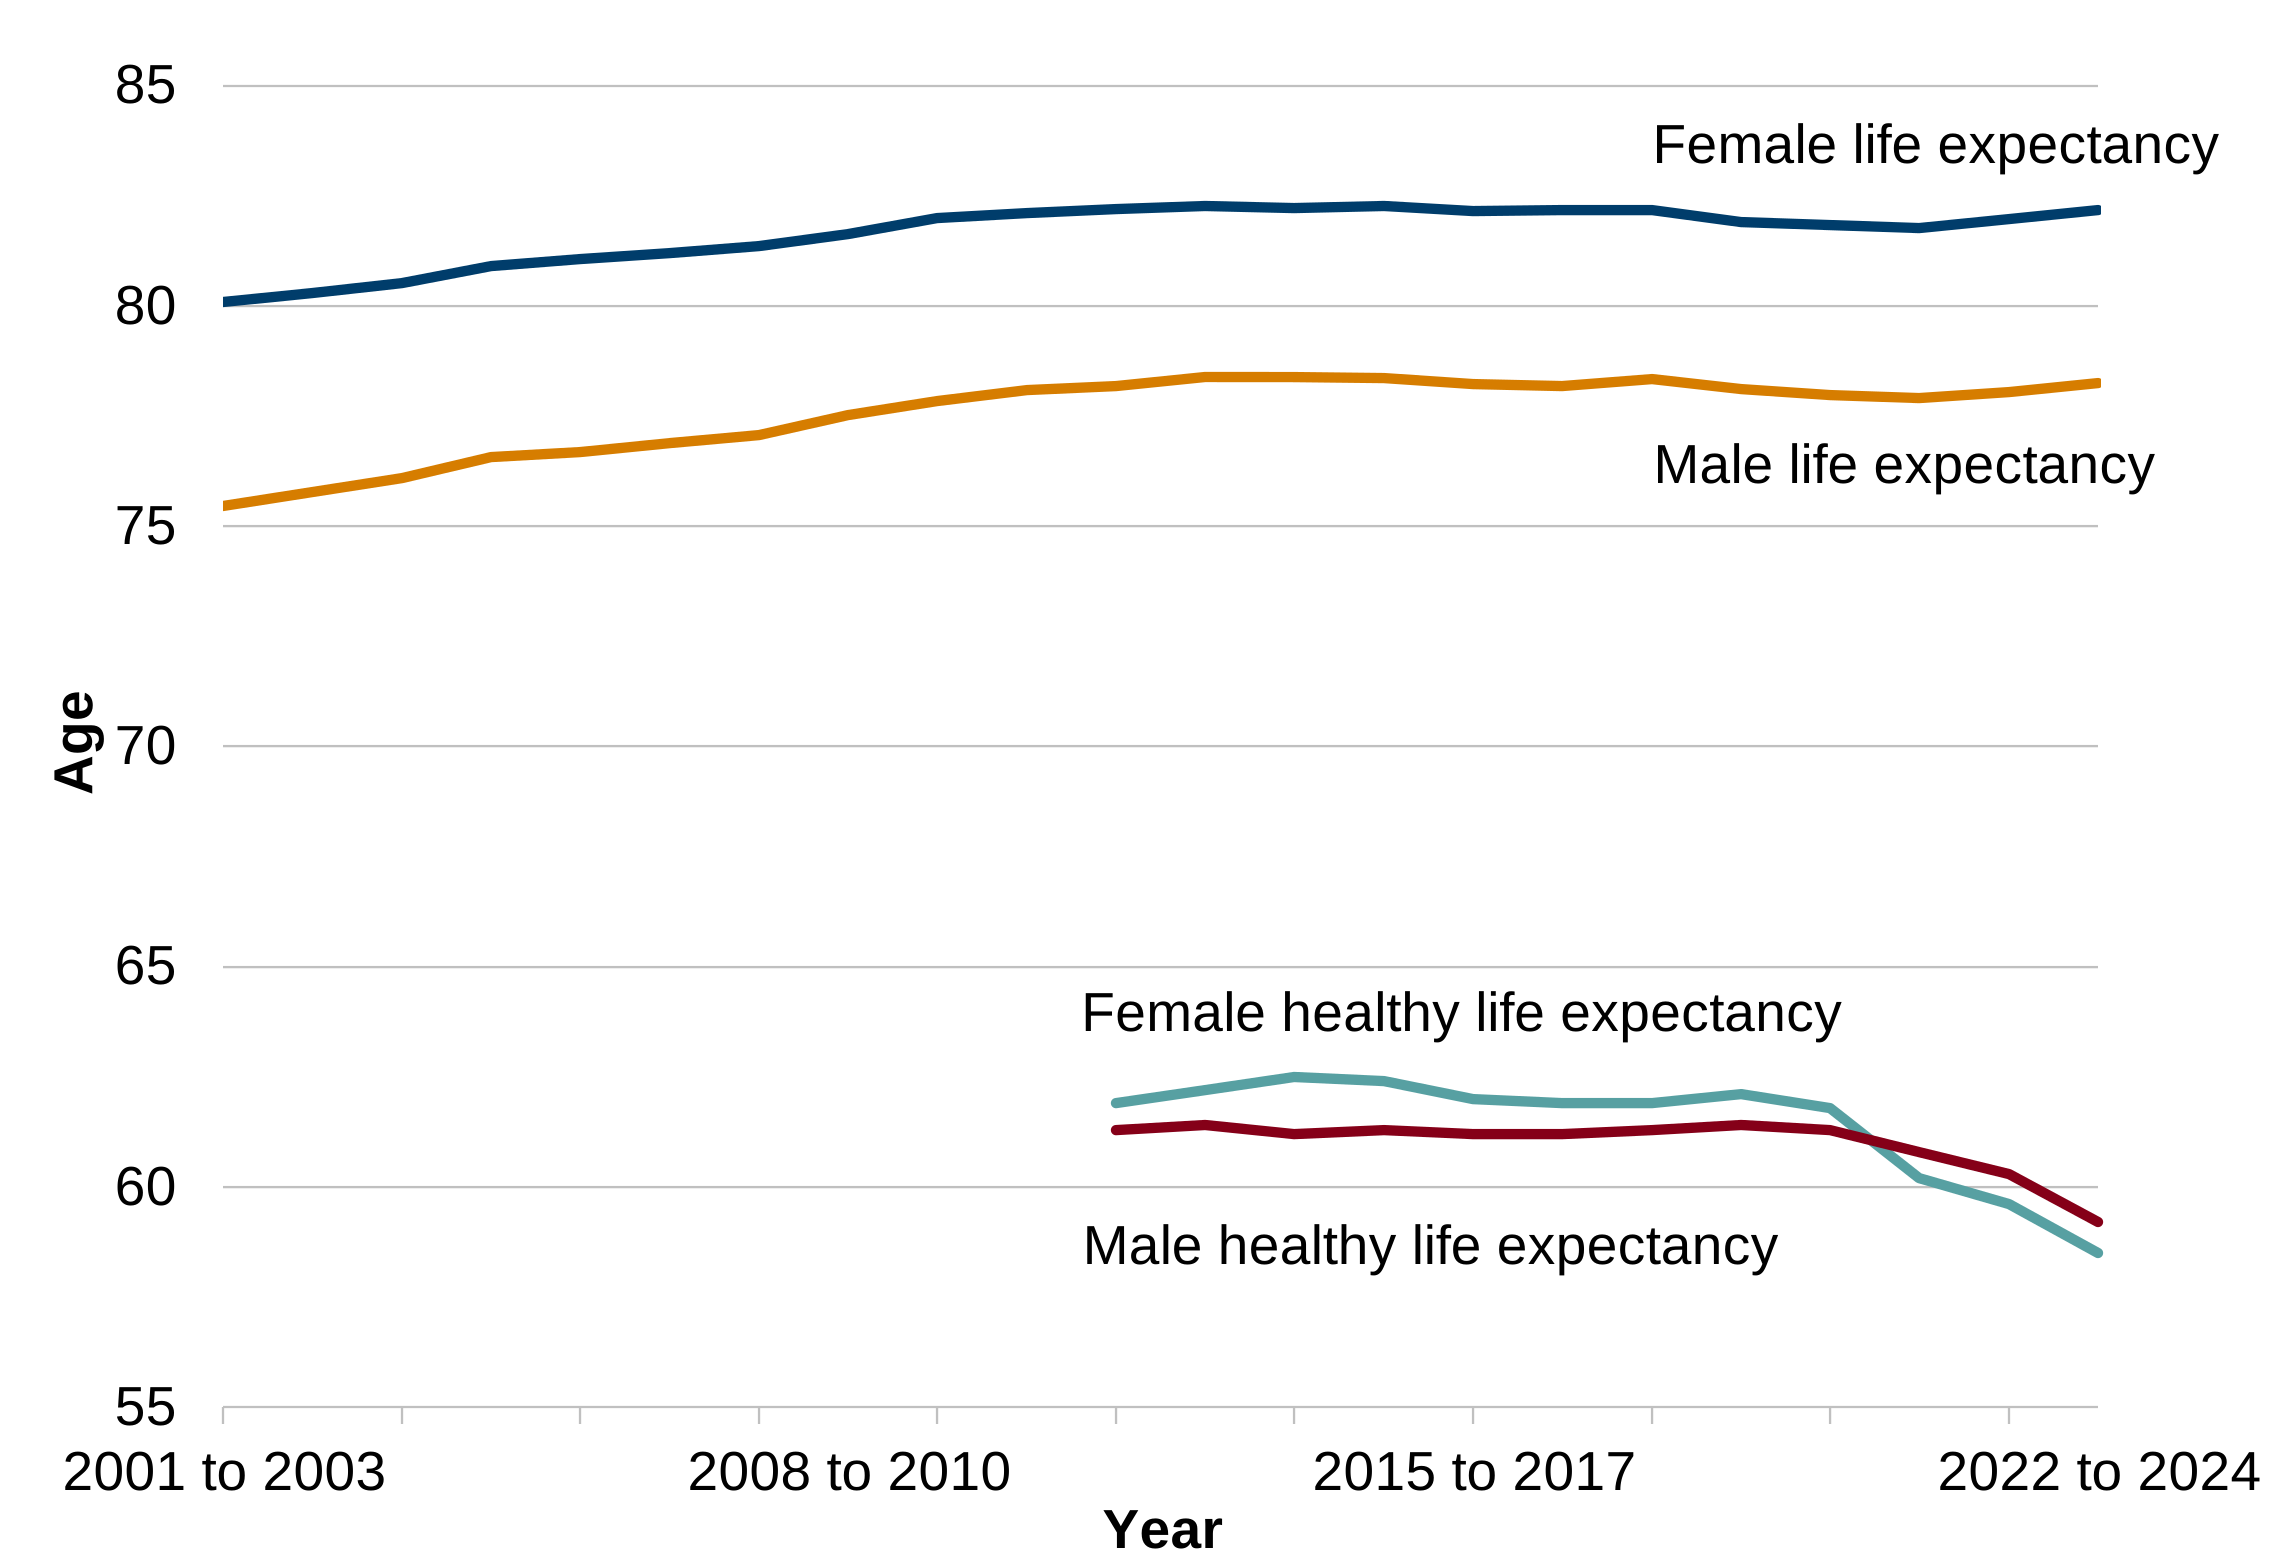
Description of figure 3.1: this line chart shows life expectancy at birth had been increasing but has recently stalled. Healthy life expectancy at birth has decreased, with a notable decrease for females.
Source: Life expectancy and healthy life expectancy, Office for National Statistics (ONS).
[Note 1] The y axis does not start at zero.
Causes of deaths
In 2025, the provisional number of deaths increased compared with 2024, but remained lower than the levels seen during the COVID-19 pandemic.
Long-term trends show falling age-standardised mortality rates, which adjust for population size and age structure, reaching their lowest levels, provisionally, in 2025.
Dementia and Alzheimer’s disease and ischaemic heart disease remained the leading causes of death, accounting for over 1 in 5 deaths together.
Figure 3.2: age-standardised mortality rates per 100,000 people, 1994 to 2025 (provisional)
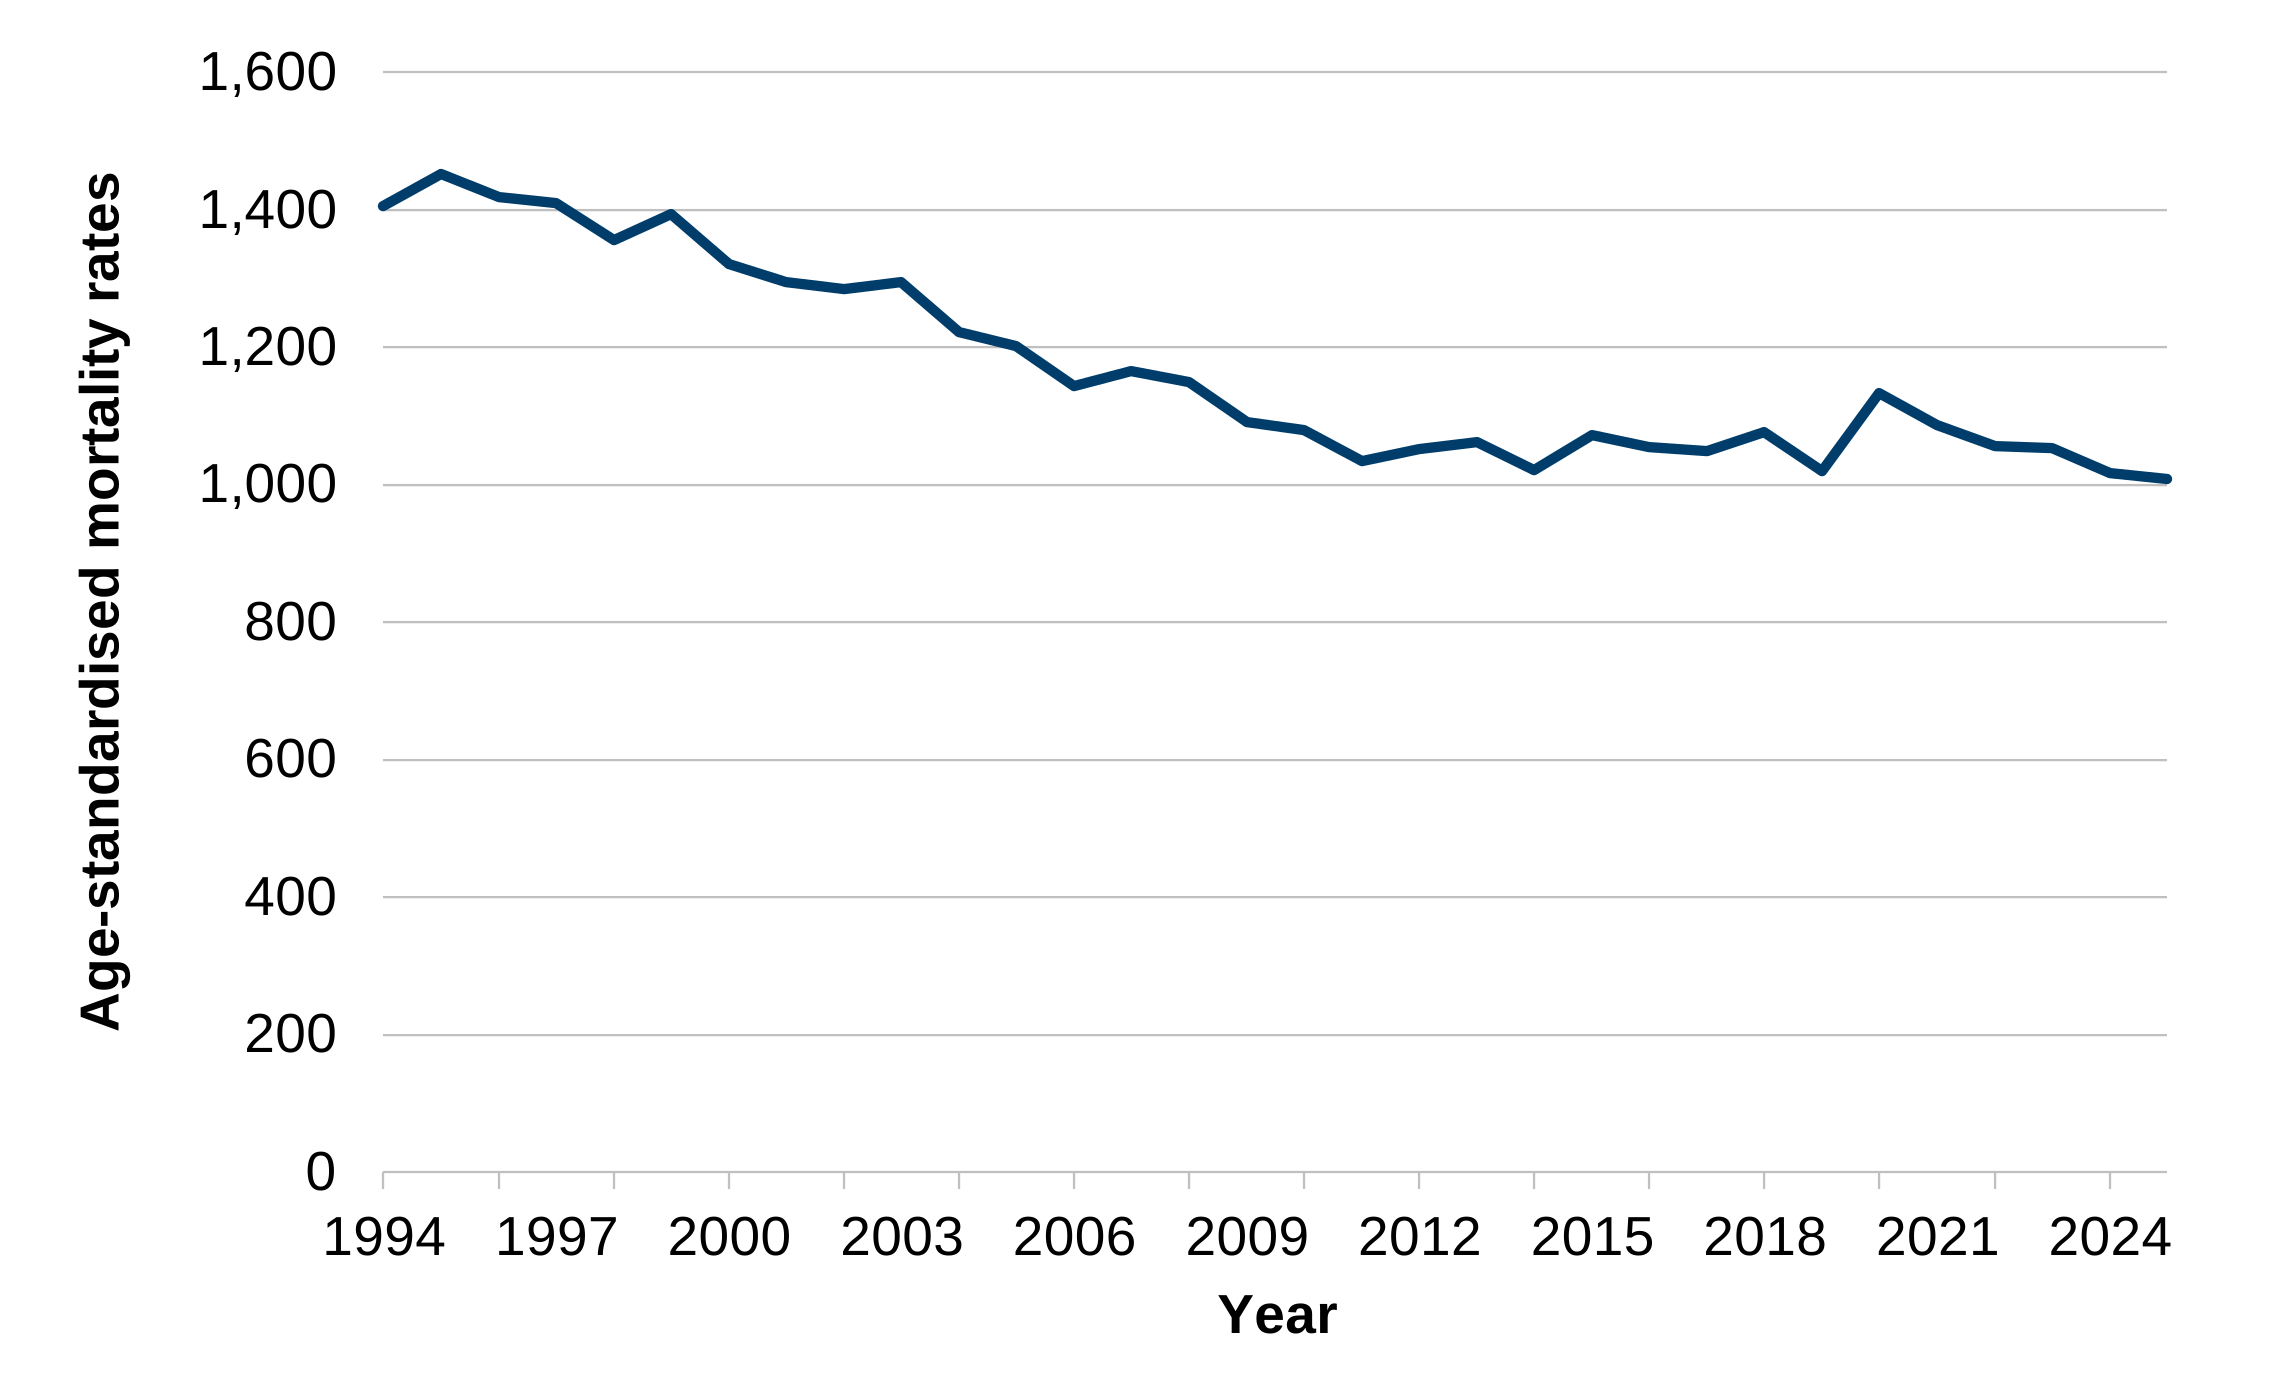
Description of figure 3.2: this line chart shows improvements in age-standardised mortality rates over the long-term.
Source: Deaths registered in Wales and England, ONS.
Inequalities in life expectancy and mortality
The national milestone on healthy life expectancy is to increase the healthy life expectancy of adults and narrow the gap in healthy life expectancy between the least and the most deprived by at least 15% by 2050.
Inequalities in life expectancy and mortality remain wide.
Between 2013 and 2024, the gap in healthy life expectancy at birth between the most and least deprived areas increased for females and for males. The gap is now at its widest on record for males, at 18.1 years.
For both females and males, the gap in life expectancy at birth between the most and least deprived areas is smaller than the corresponding gap in healthy life expectancy at birth. However, both gaps have widened, indicating growing inequality.
Figure 3.3: absolute gap in life expectancy and healthy life expectancy at birth between the most and least deprived areas, females and males, 2011 to 2024
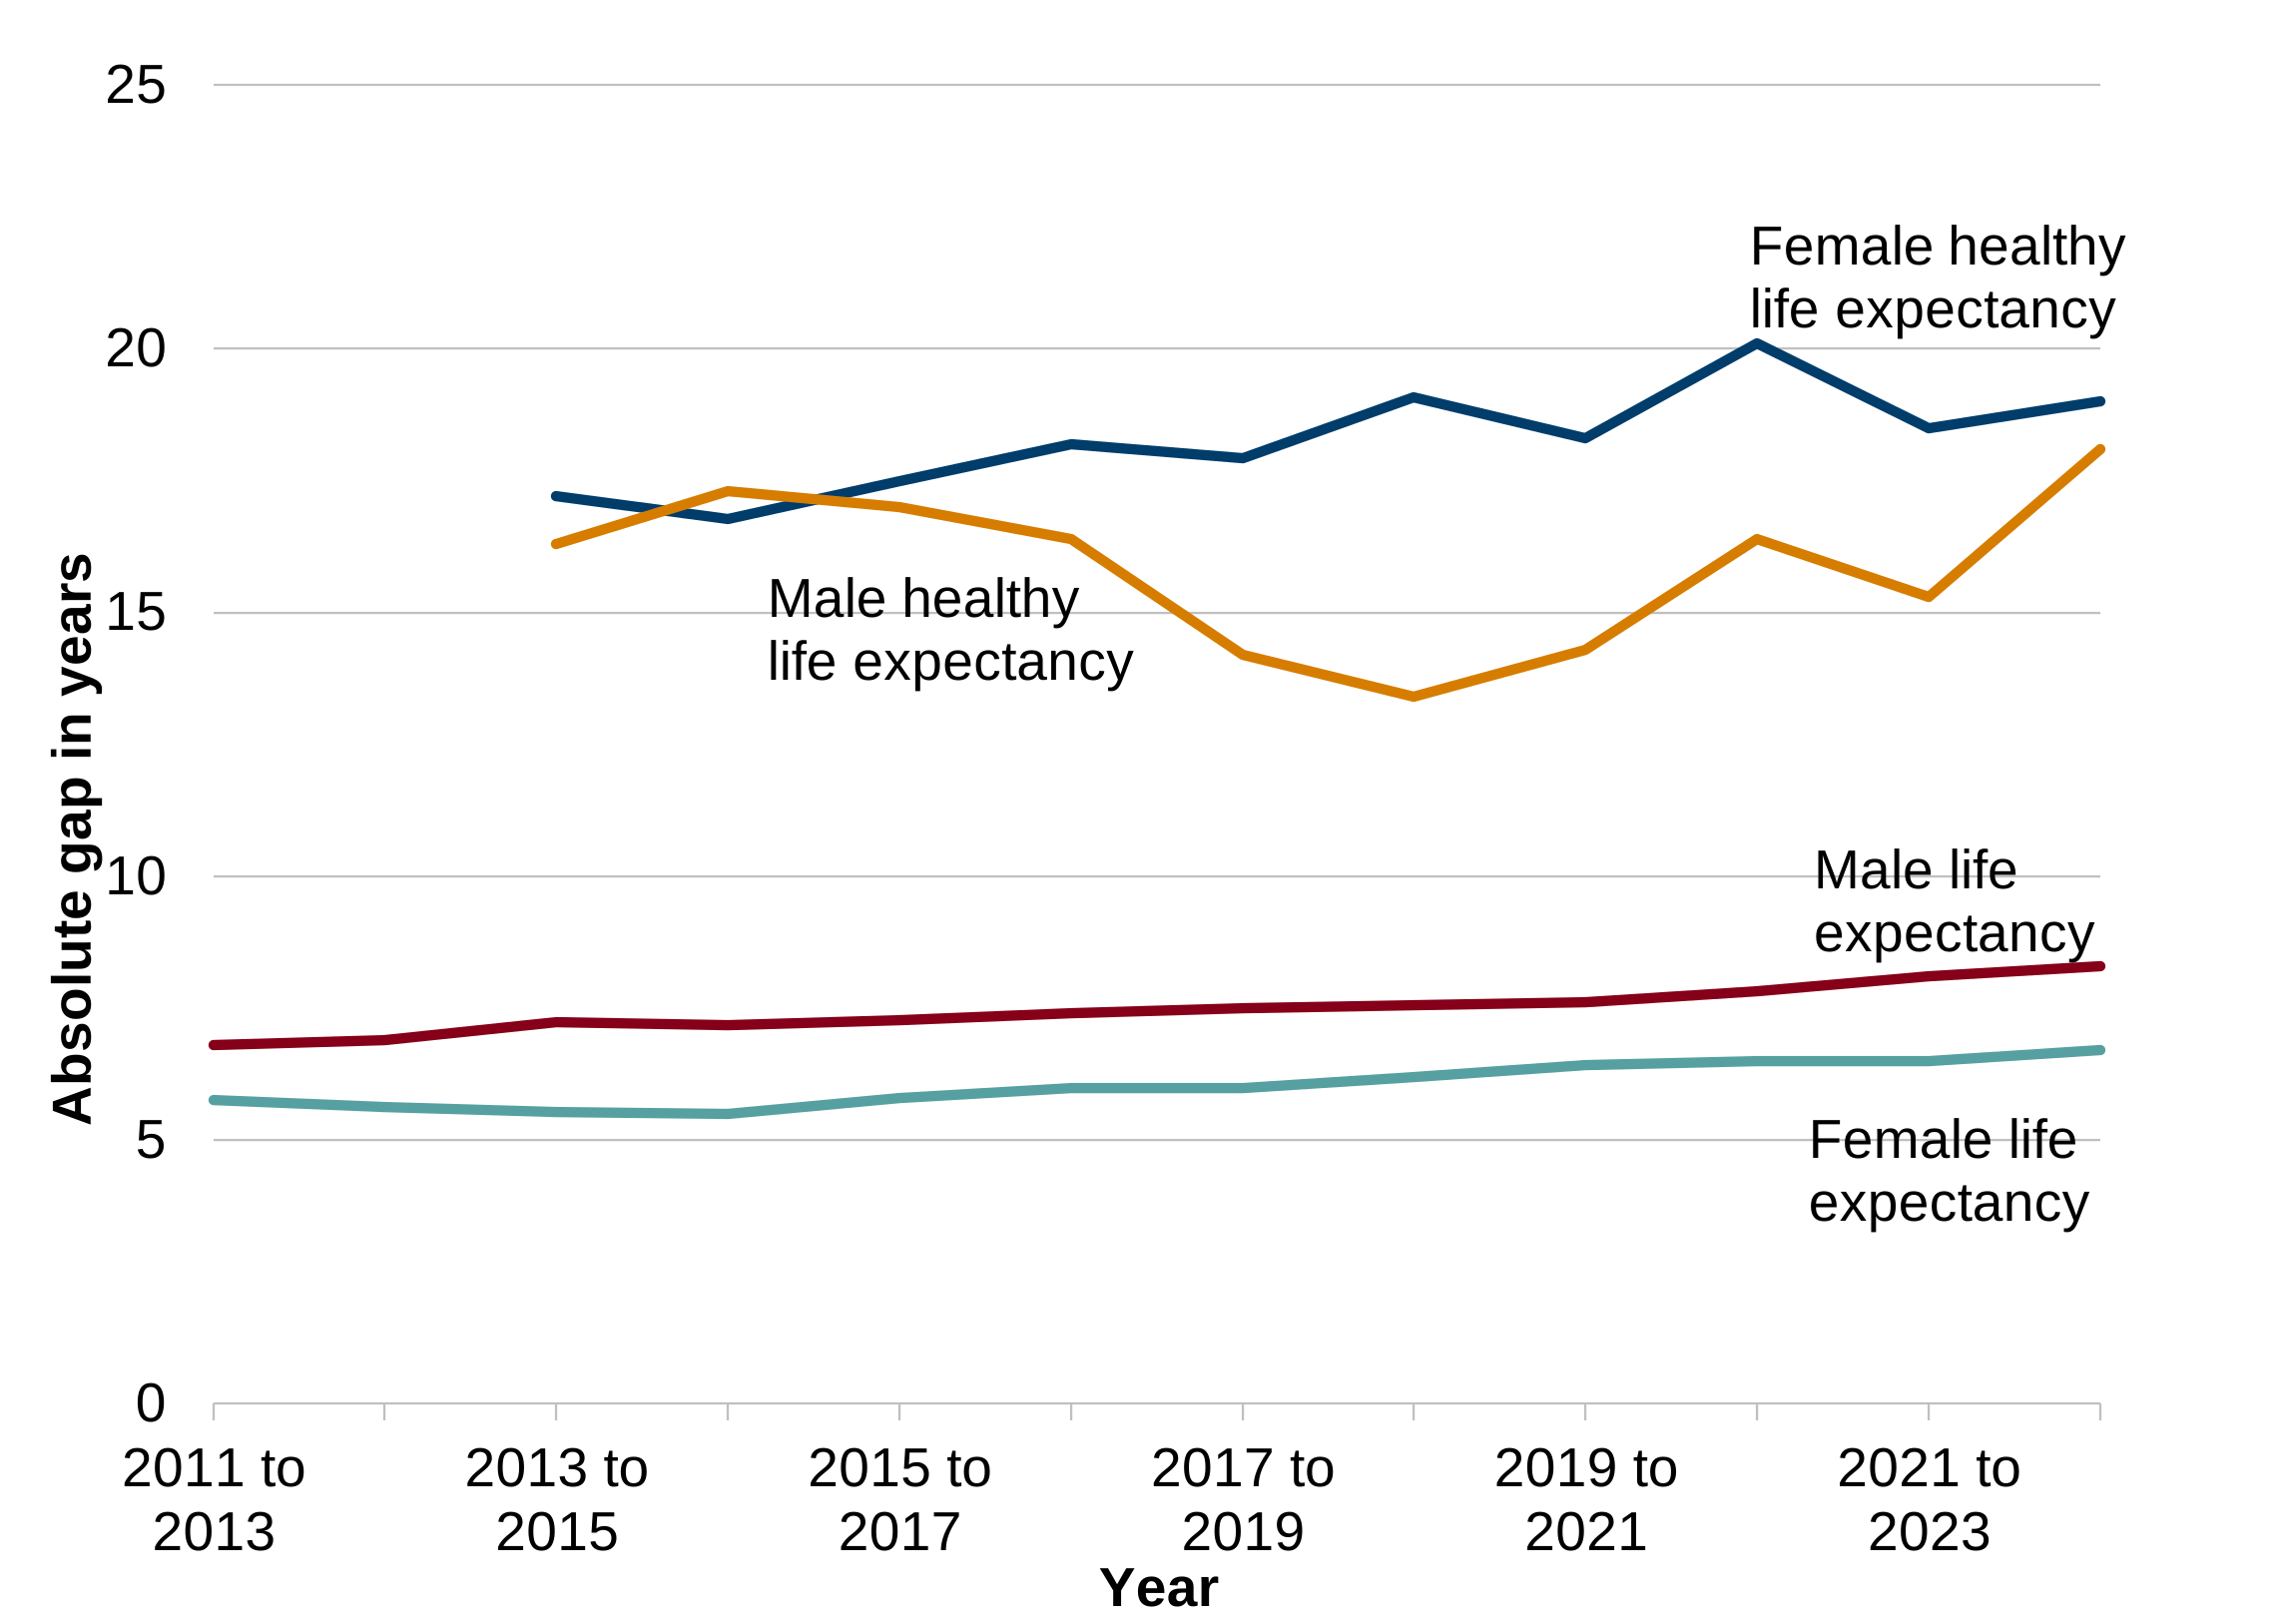
Description of figure 3.3: this line chart shows the gap in healthy life expectancy at birth has increased for both females and males. The life expectancy at birth gap is smaller for females and males than the equivalent gap for healthy life expectancy, but has been increasing for both.
Source: Healthy life expectancy by national area deprivation, Wales, ONS.
Healthy babies
The percentage of low birthweight singleton babies has been relatively stable over time, at between 5% and 6%. However, there has been an upward trend since 2015 and was at 6.0% in 2025, down slightly since 2024.
In 2025, 6.6% of female babies and 5.5% of male babies had low birth weight. This is consistent with long-term patterns.
Figure 3.4: percentage of live singleton births with a birth weight of under 2,500g, 2005 to 2025
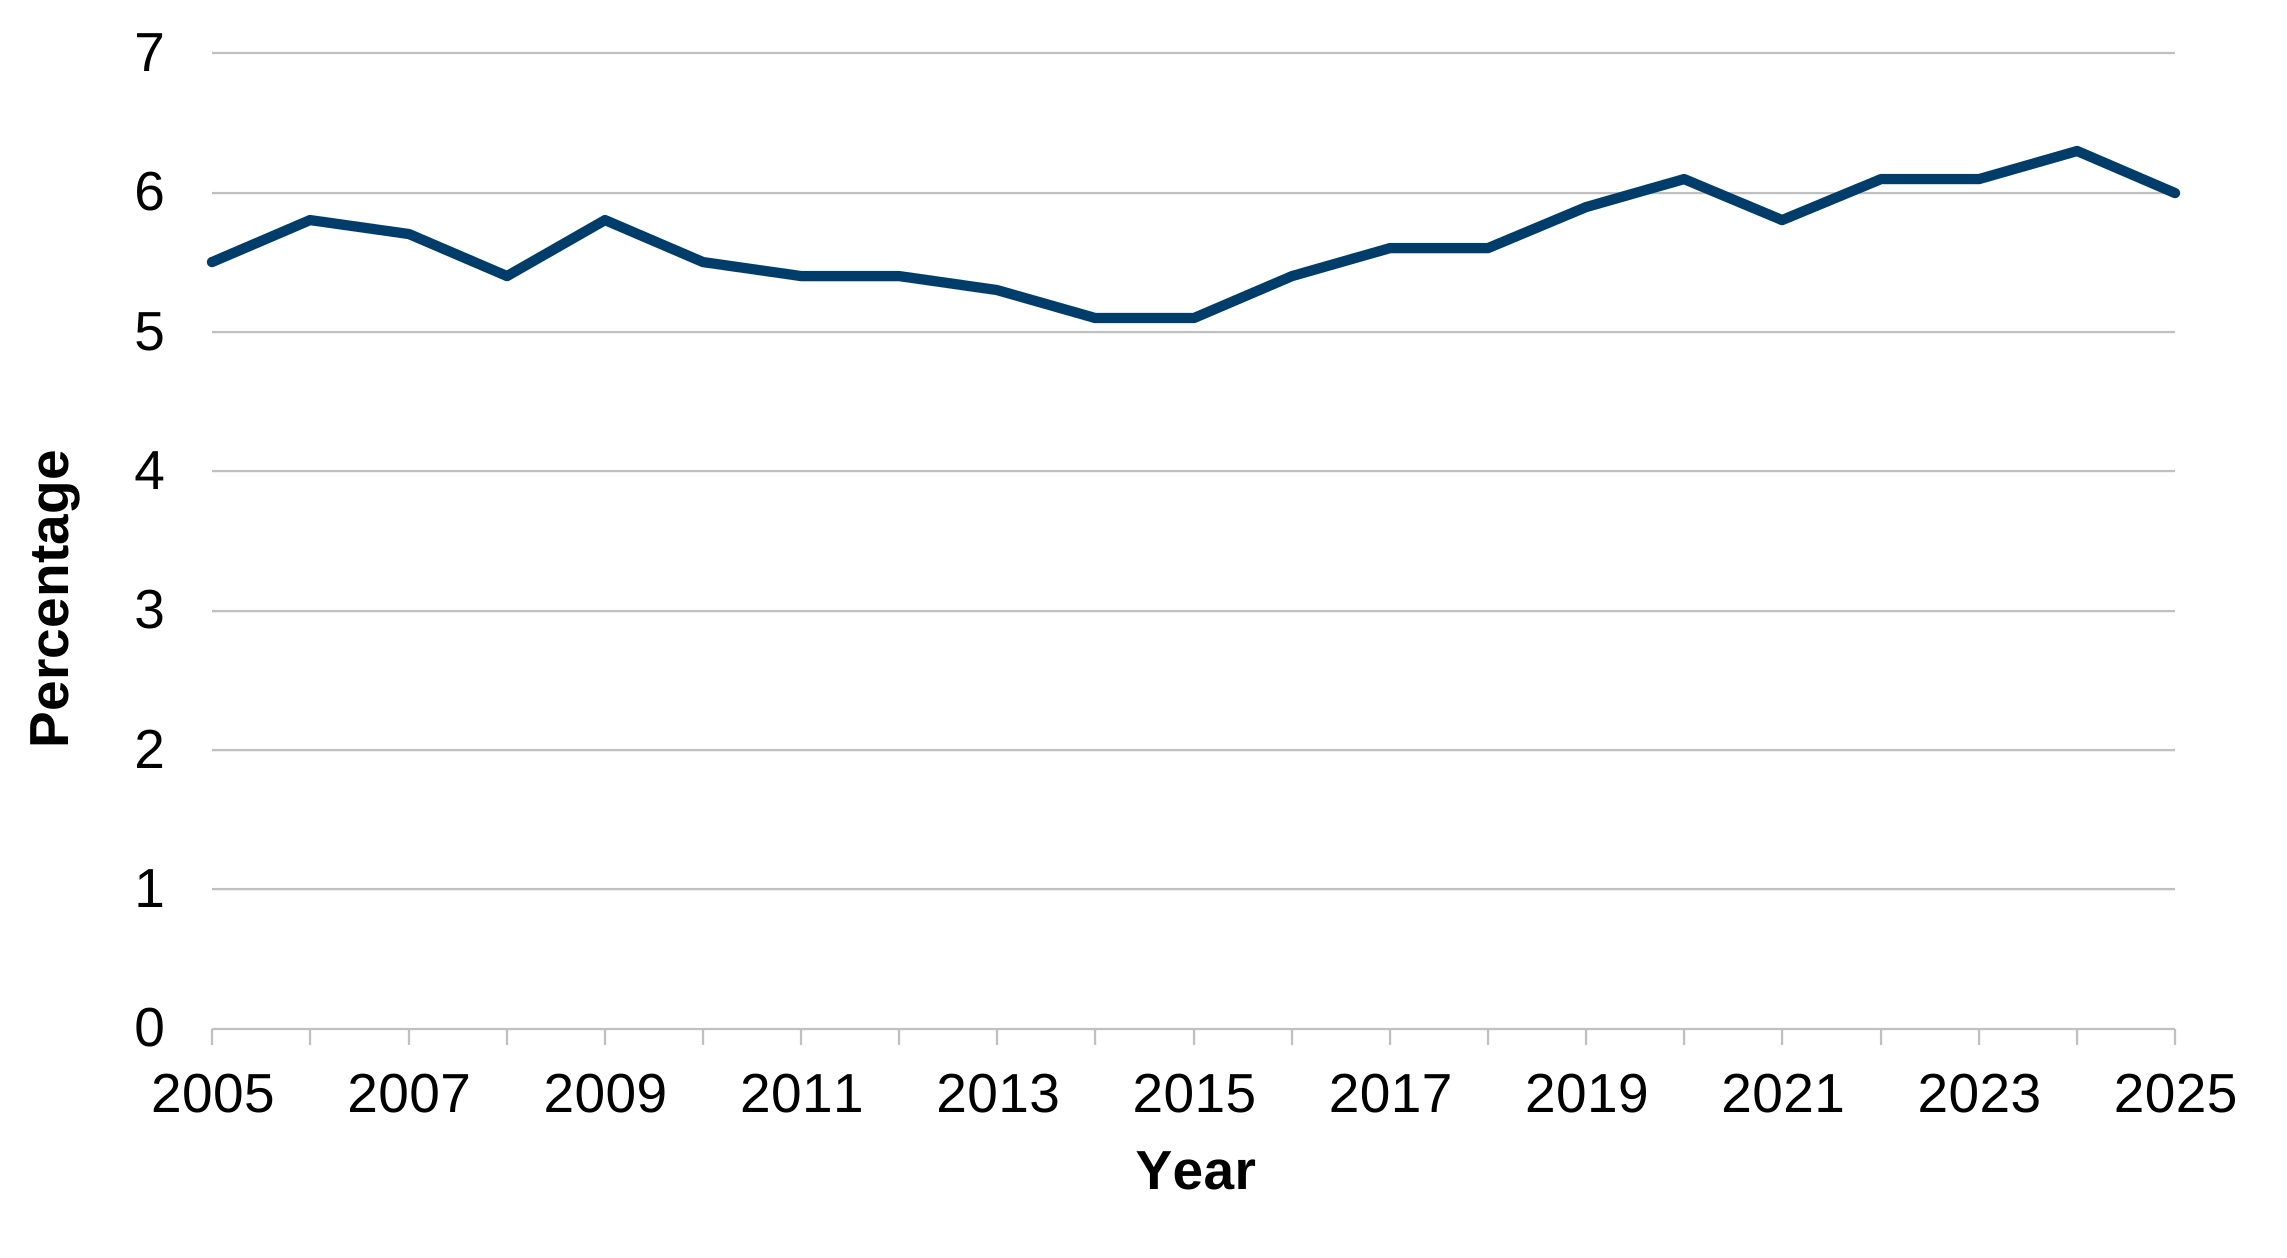
Description of figure 3.4: this line chart shows the percentage of low birth weight babies has typically fluctuated between 5% and 6%. There has been an upward trend since 2015, with the highest rate recorded in 2024.
Source: Maternity and birth statistics, Welsh Government.
Healthy lifestyle behaviours
Healthy lifestyle behaviours include not smoking, drinking within guidelines, eating fruit and vegetables, being physically active, and maintaining a healthy weight. The national milestones on adult and children’s healthy lifestyle behaviours are:
- to increase the percentage with 2 or more healthy lifestyle behaviours to more than 97% for adults by 2050
- to increase the percentage with 2 or more healthy lifestyle behaviours to 94% for children by 2035, and to more than 99% by 2050
The National Survey for Wales was adapted due to the COVID-19 pandemic. As such, results from the financial year 2020 to 2021 are not comparable with previous years. There are no new data from the National Survey for Wales, which means that the latest data available for the national indicators on healthy lifestyle behaviours are from 2024 to 2025.
Prior to the COVID-19 pandemic, between 2016 and 2020, the percentage of adults with 2 or more healthy lifestyle behaviours decreased and was short of the national milestone. The trend since 2020 to 2021 appears to have improved slightly but is not comparable with previous years. It still remains short of the national milestone.
In 2024 to 2025, 93.6% of adults reported following 2 or more healthy lifestyle behaviours. The percentage of adults with 2 or more healthy lifestyle behaviours were less common among males, adults aged 45 to 64, and people living in more deprived areas.
Analysis looking specifically at smoking and drinking alcohol suggests that the factors linked with smoking in 2024 to 2025 were:
- being single
- not being religious
- being in bad health
- having a mental health condition
- having lower levels of qualifications
- renting their home
Similarly, the factors linked with drinking alcohol above guidelines were:
- being male
- being older
- being in the white ethnic group
- being in good general health
- participating in sport and having higher levels of qualifications
Figure 3.5: percentage of adults with 2 or more healthy lifestyle behaviours, 2016 to 2024 [Note 1], [Note 2], [Note 3], [Note 4]
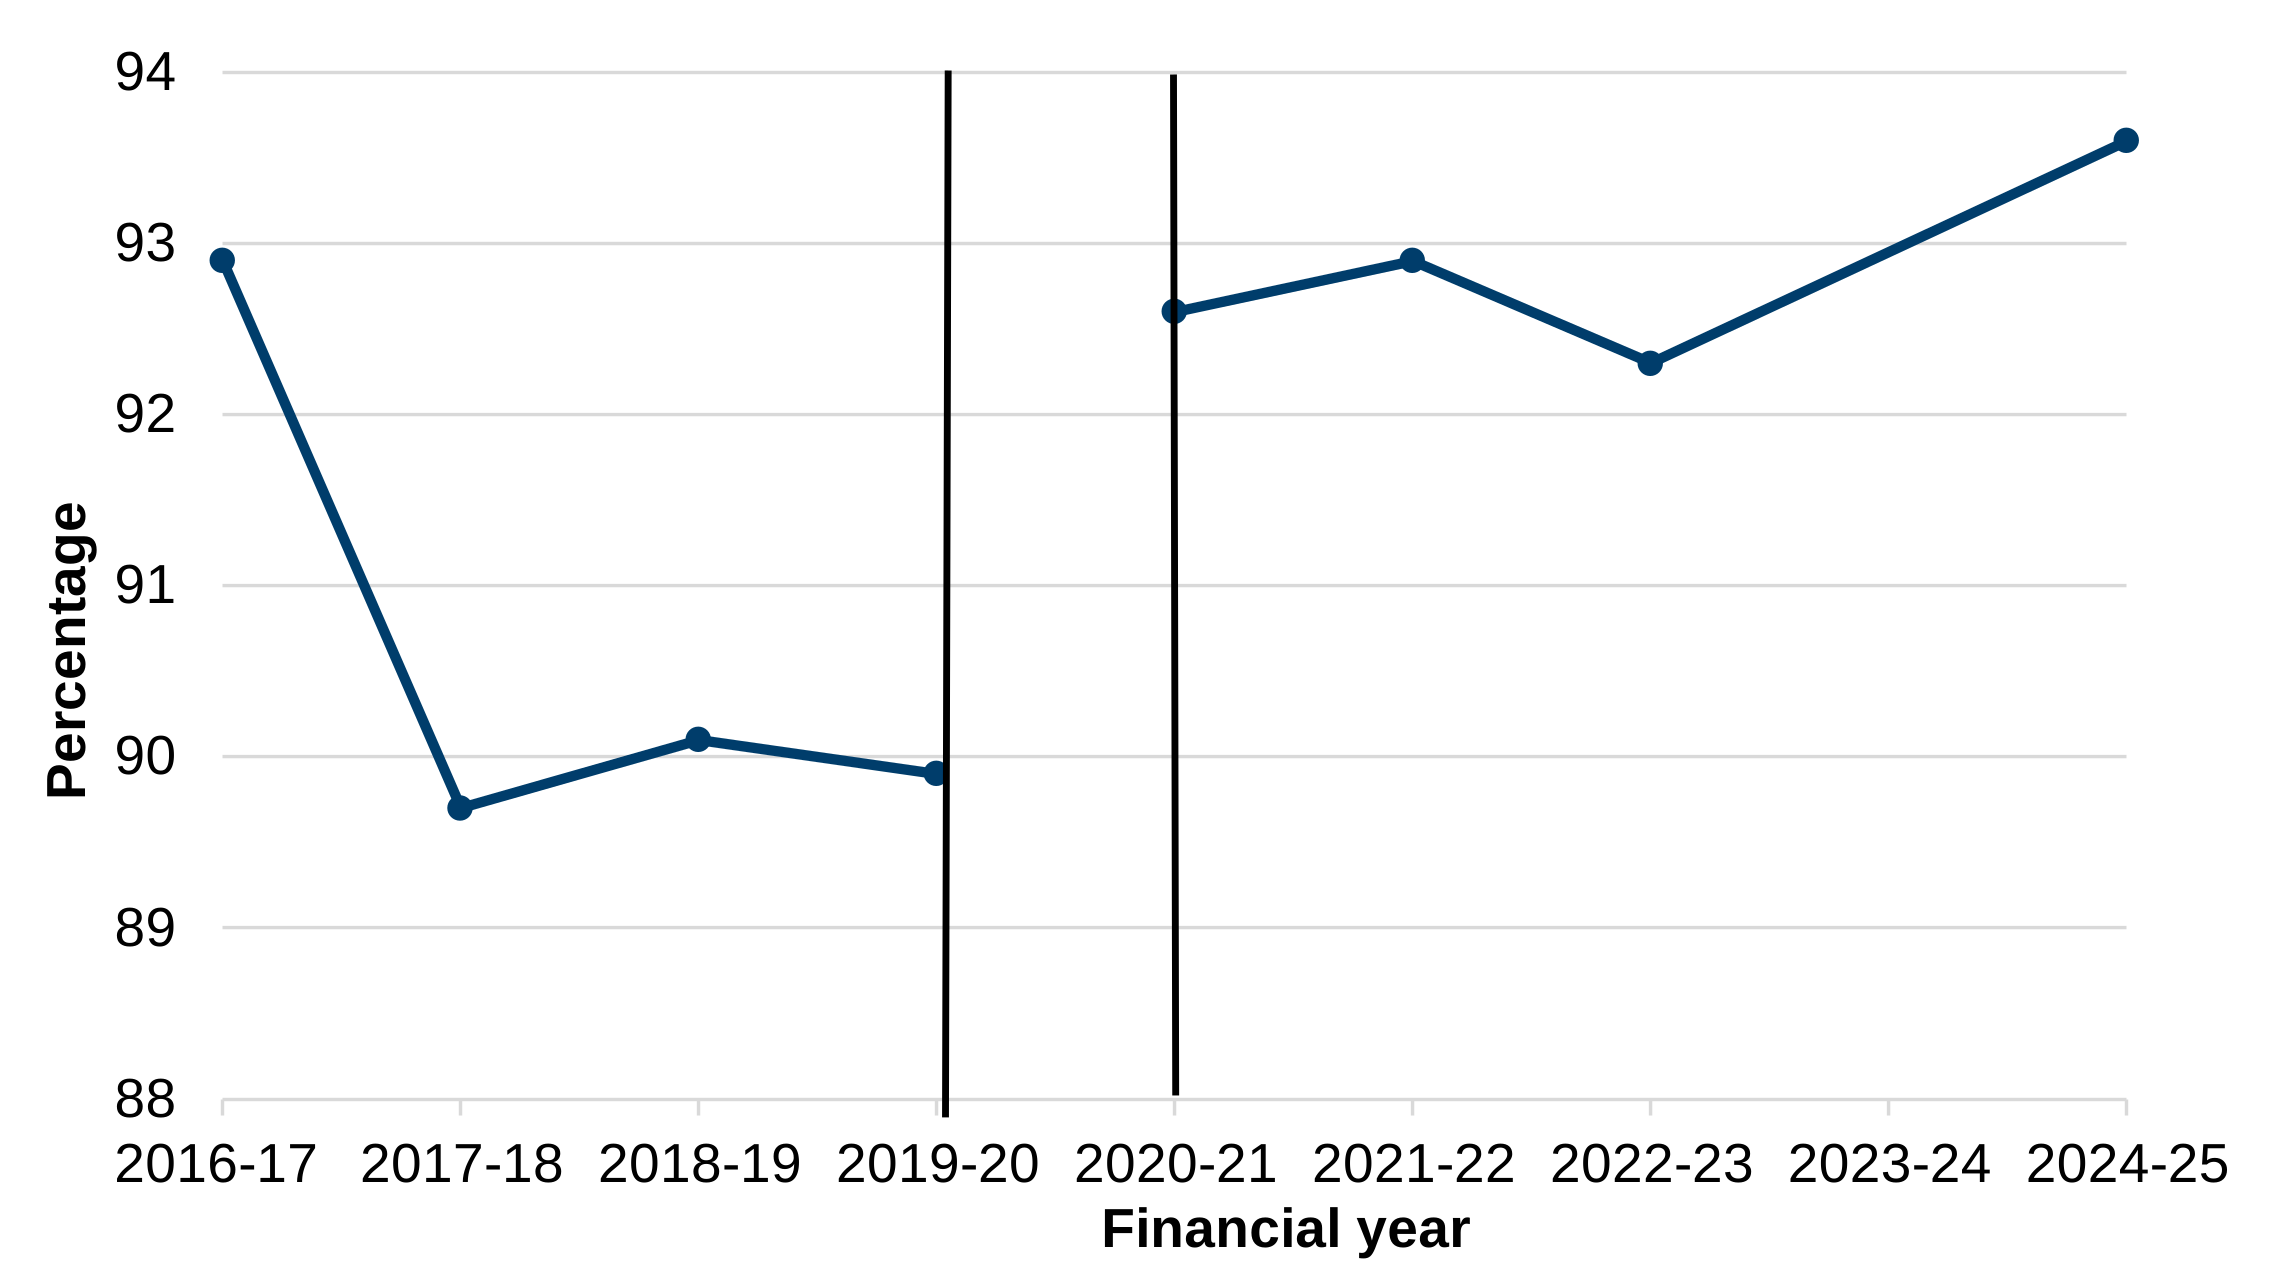
Description of figure 3.5: this line chart shows the percentage of adults with 2 or more healthy lifestyle behaviours decreased between 2016and 2020. The trend since 2020 to 21 appears to have improved slightly.
Source: National Survey for Wales, Welsh Government.
[Note 1] Results from 2020 to 2021 are not comparable with previous years.
[Note 2] Results from 2020 to 2021 are for quarter 4 only and not annual data.
[Note 3] The National Survey did not take place in 2023 to 2024 therefore there are no data for that year.
[Note 4] The y axis does not start at zero.
In the academic year 2023 to 2024, 90.1% of young people aged 11 to 16 demonstrated 2 or more healthy lifestyle behaviours, an increase from previous years.
Young people reported low levels of smoking (2.6%) and drinking alcohol (35.6%) but also reported low levels of eating fruit or vegetables daily (46.5%) or being physically active for an hour or more each day (18.3%).
Since 2017, smoking and alcohol behaviours have improved, but diet and physical activity have remained the same.
Figure 3.6: percentage of young people aged 11 to 16 with 2 or more healthy lifestyle behaviours, between academic years 2017 to 2023 [Note 1]
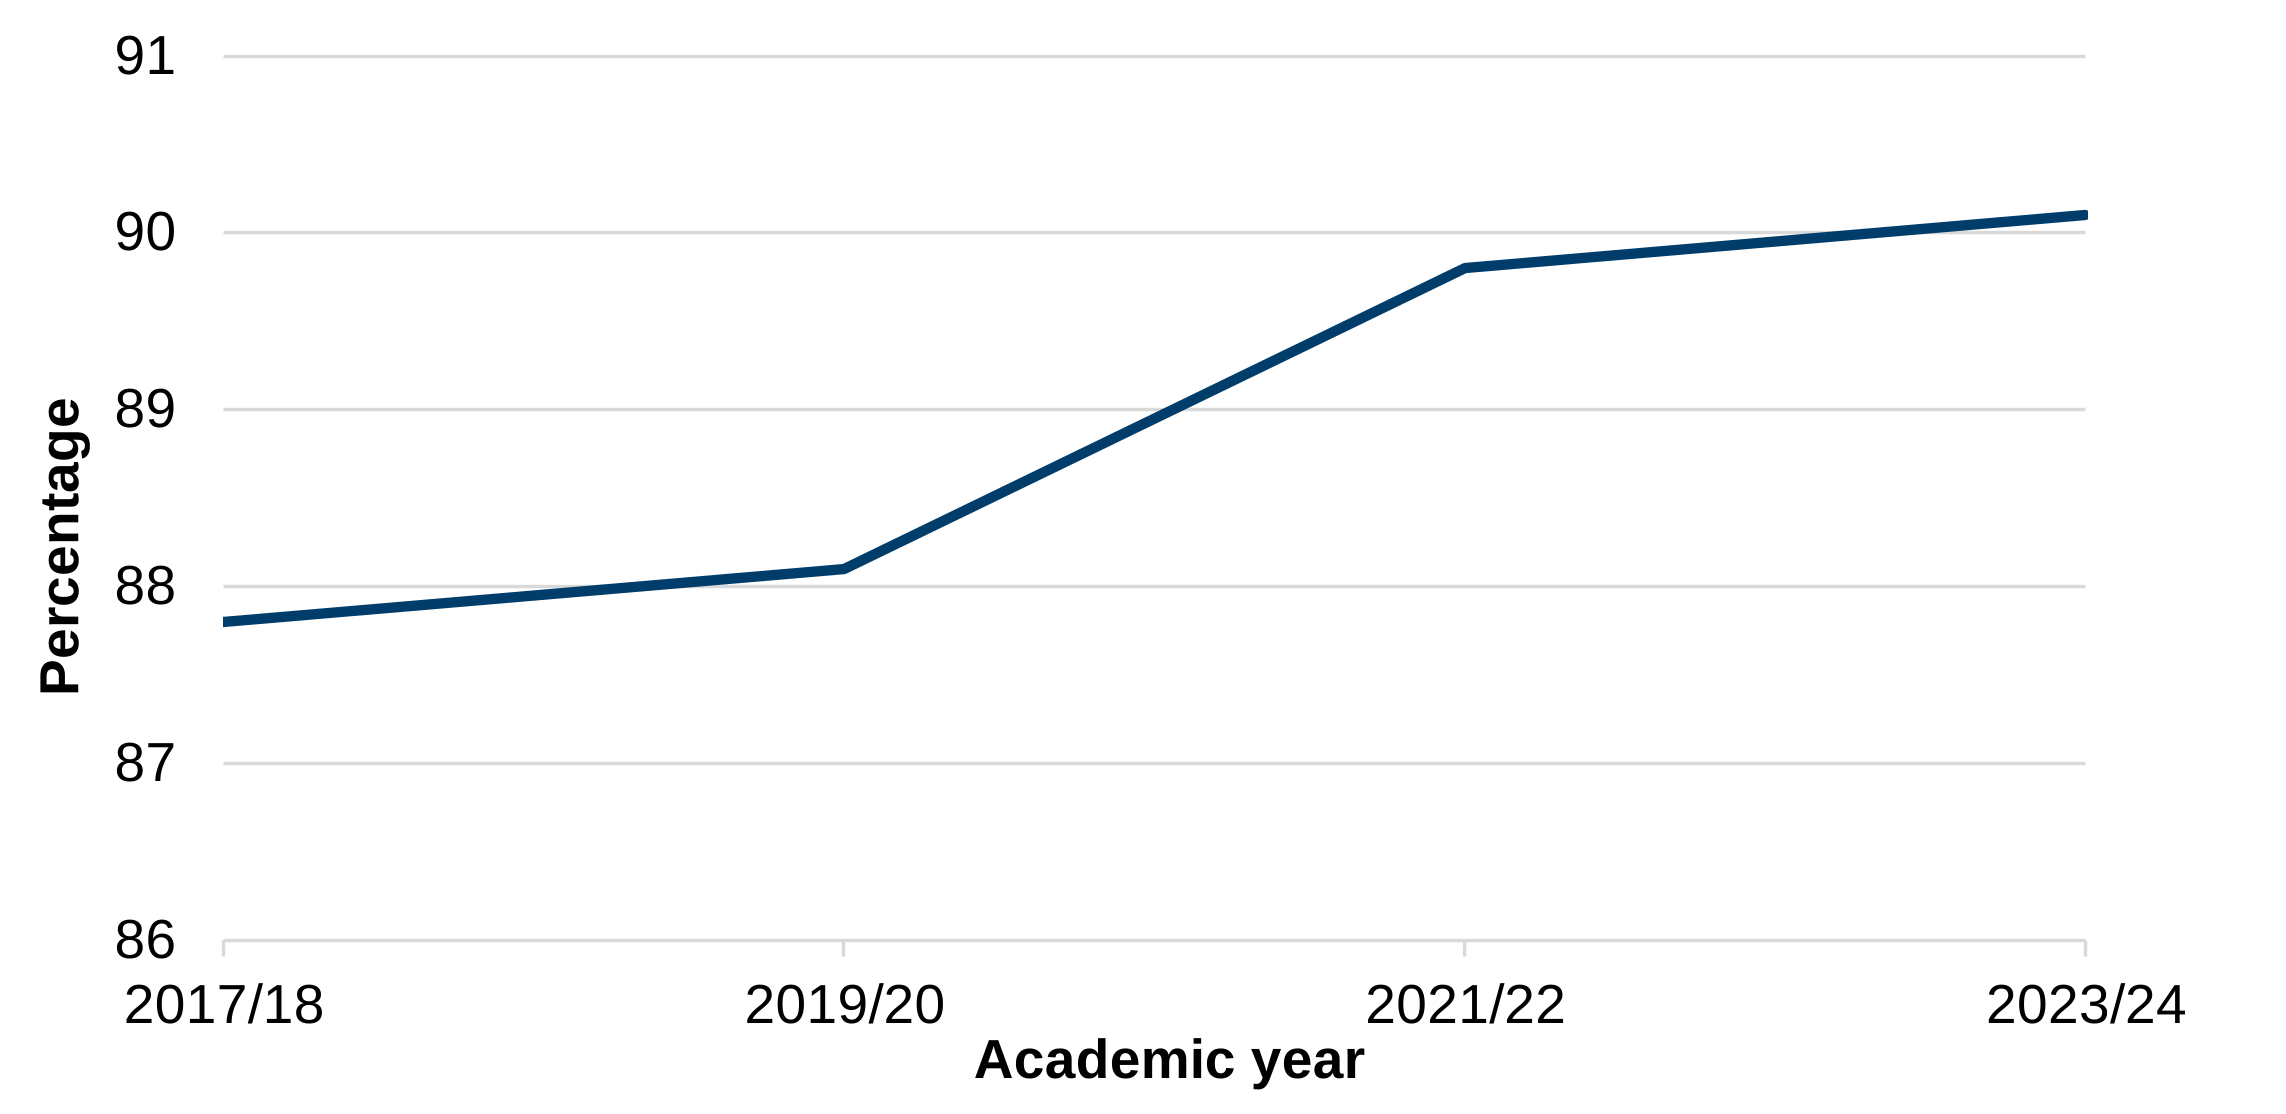
Description of figure 3.6: this line chart shows the percentage of young people with 2 or more healthy lifestyle behaviours has increased between 2017 to 2024.
Source: School Health Research Network Student Health and Well-being Survey.
[Note 1] The y axis does not start at zero.
Mental health and wellbeing
The national milestone on mental wellbeing is to improve adult and children’s mean mental wellbeing and eliminate the gap in adult and children’s mean mental wellbeing between the most deprived and least deprived areas in Wales by 2050.
In the financial year 2024 to 2025, the average mental wellbeing score among adults was 48.4 on the Warwick-Edinburgh mental wellbeing scale (WEMWBS), indicating medium wellbeing, similar to the score in 2022 to 2023.
33% of adults’ scores corresponded to low mental wellbeing, 52% to medium mental wellbeing and 15% to high mental wellbeing.
The gap in the average WEMWBS score between the most and least deprived areas has remained similar since 2022 to 2023.
Figure 3.7: average Warwick-Edinburgh mental wellbeing scale score for adults, by deprivation, 2016 to 2024 [Note 1], [Note 2]
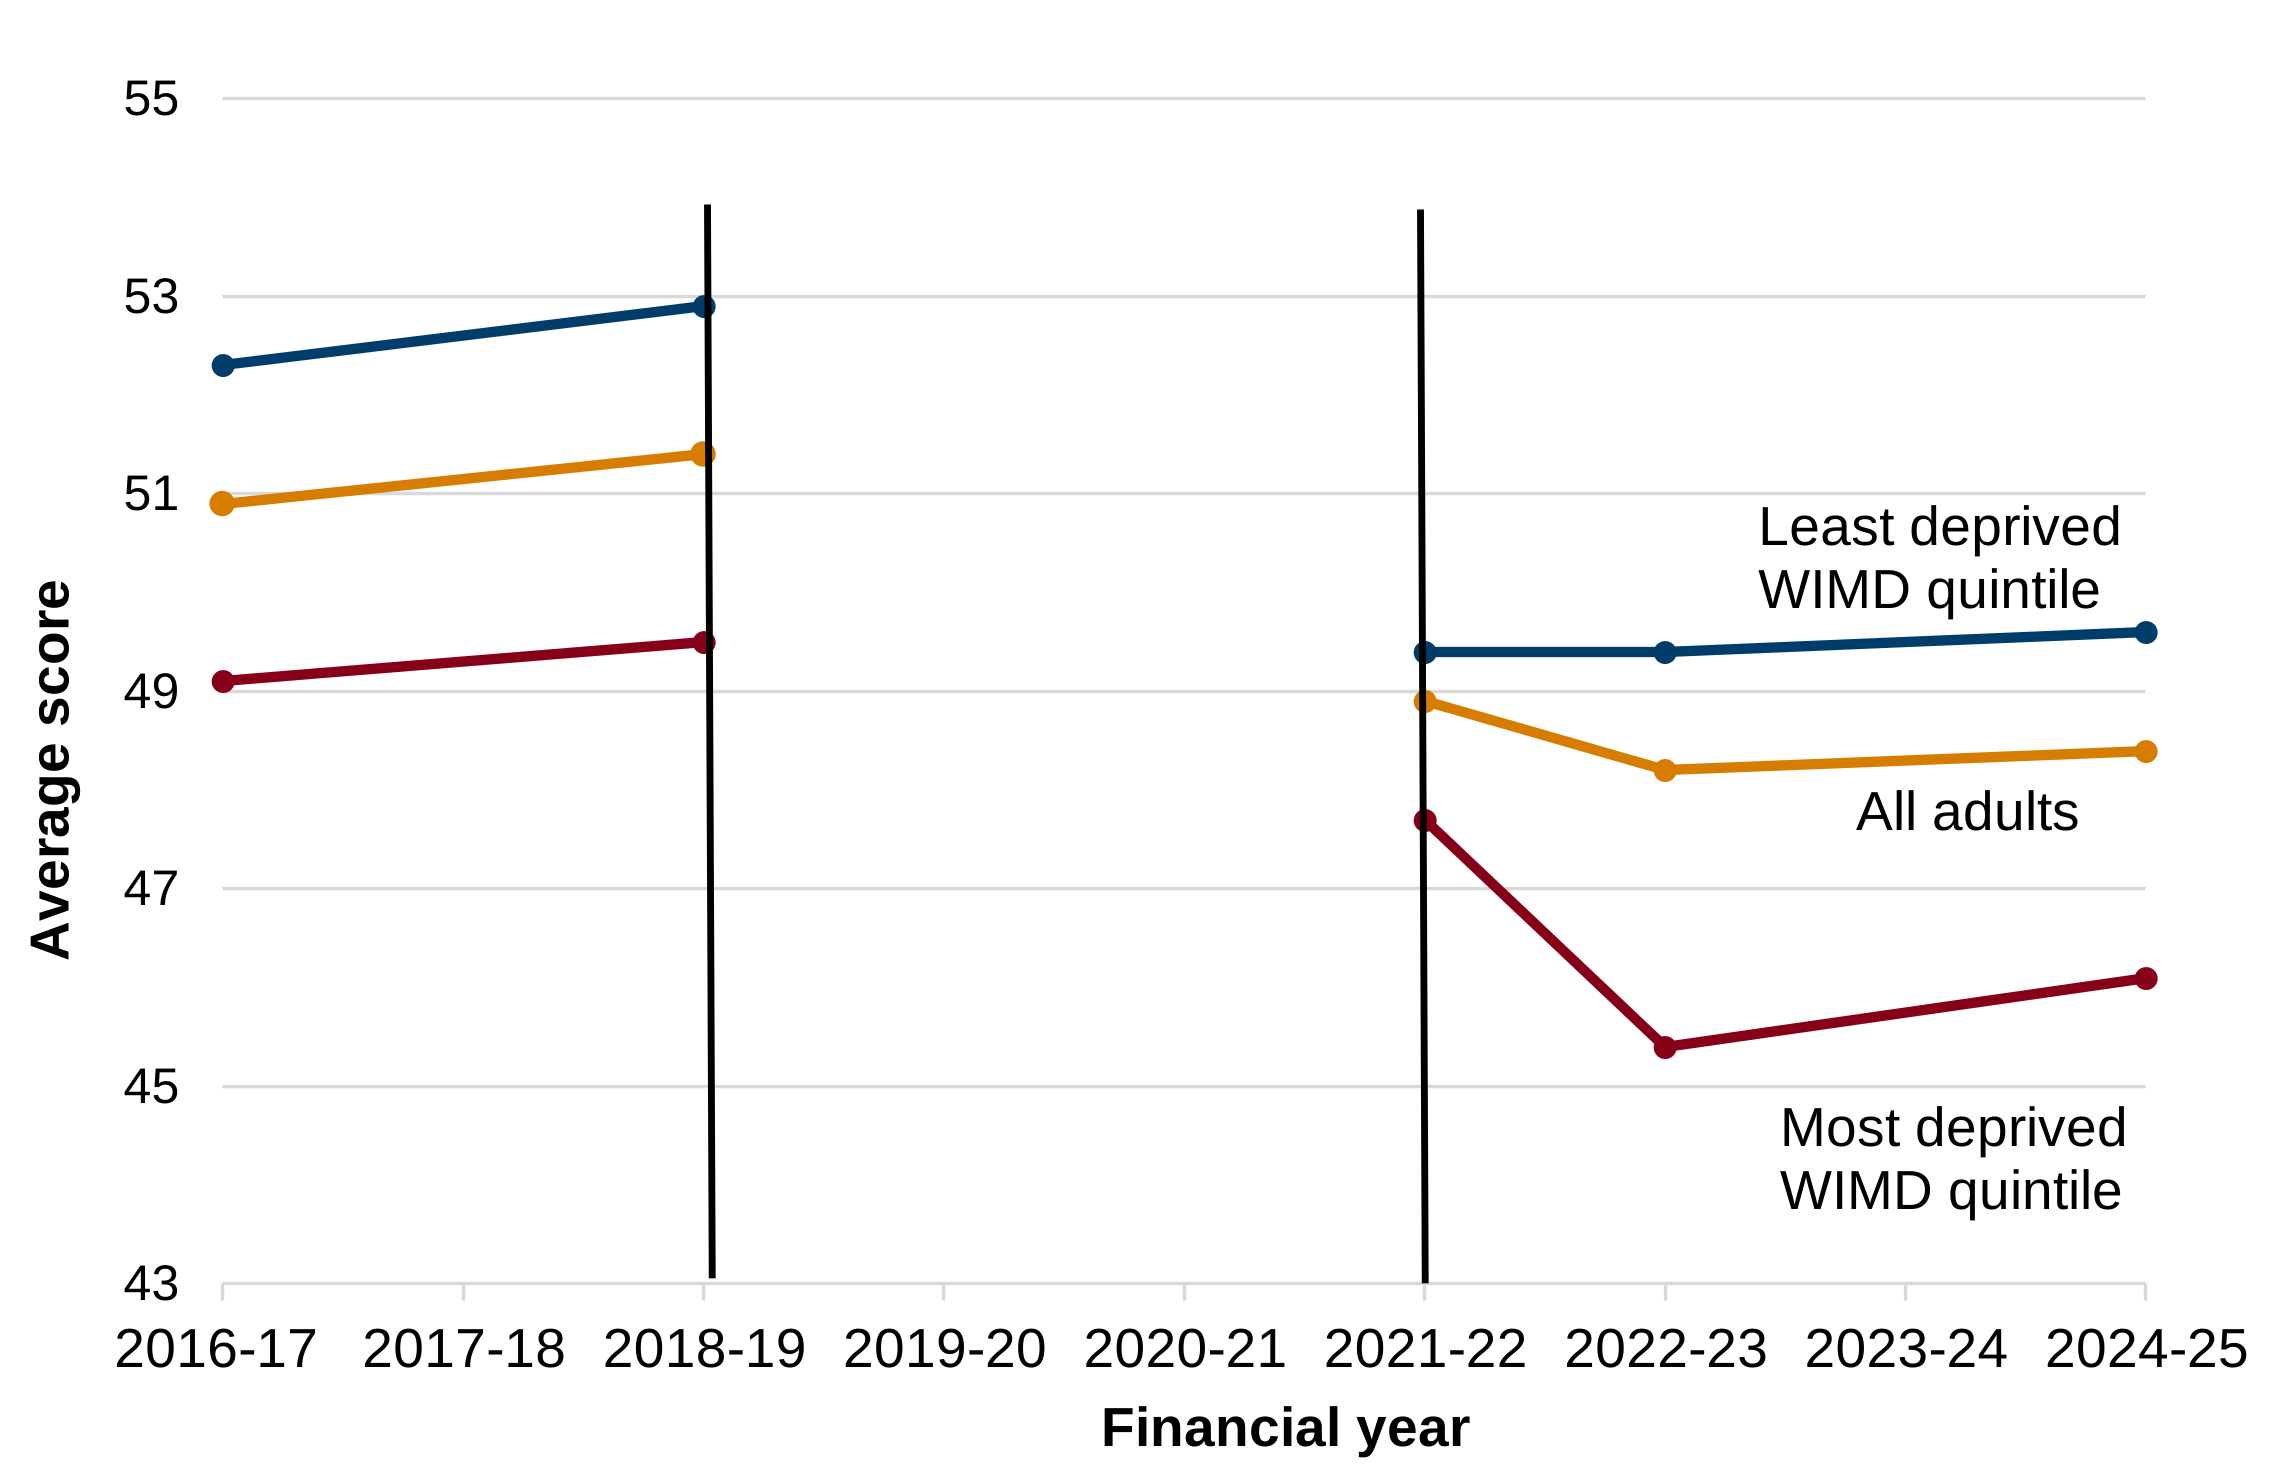
Description of figure 3.7: this line chart shows the average mental wellbeing score has not shown significant change prior to 2018 to 2019, or since 2021 to 2022.
Source: National Survey for Wales, Welsh Government.
[Note 1] Results from 2021 to 2022 are not comparable with previous years.
[Note 2] The y axis does not start at zero.
Using the short Warwick-Edinburgh mental wellbeing scale (SWEMWBS), the average mental wellbeing score for young people aged 11 to 16, fell from 24.0 in 2017 to 2018 to 23.5 in 2023 to 2024, indicating a decline in mental wellbeing.
Scores from the SWEMWBS are based on a shorter set of questions than the adult WEMWBS, so the scores are not directly comparable.
The gap between low and high family affluence groups has widened, from 1.7 in 2017 to 2018 to 2.0 in 2023 to 2024.
Young people identifying as neither a girl nor a boy reported the lowest wellbeing, followed by girls, with boys reporting the highest wellbeing. Mental wellbeing was generally lower for older children.
Figure 3.8: average short Warwick-Edinburgh mental wellbeing scale score for young people aged 11 to 16, by affluence, between academic years 2017 to 2023 [Note 1]
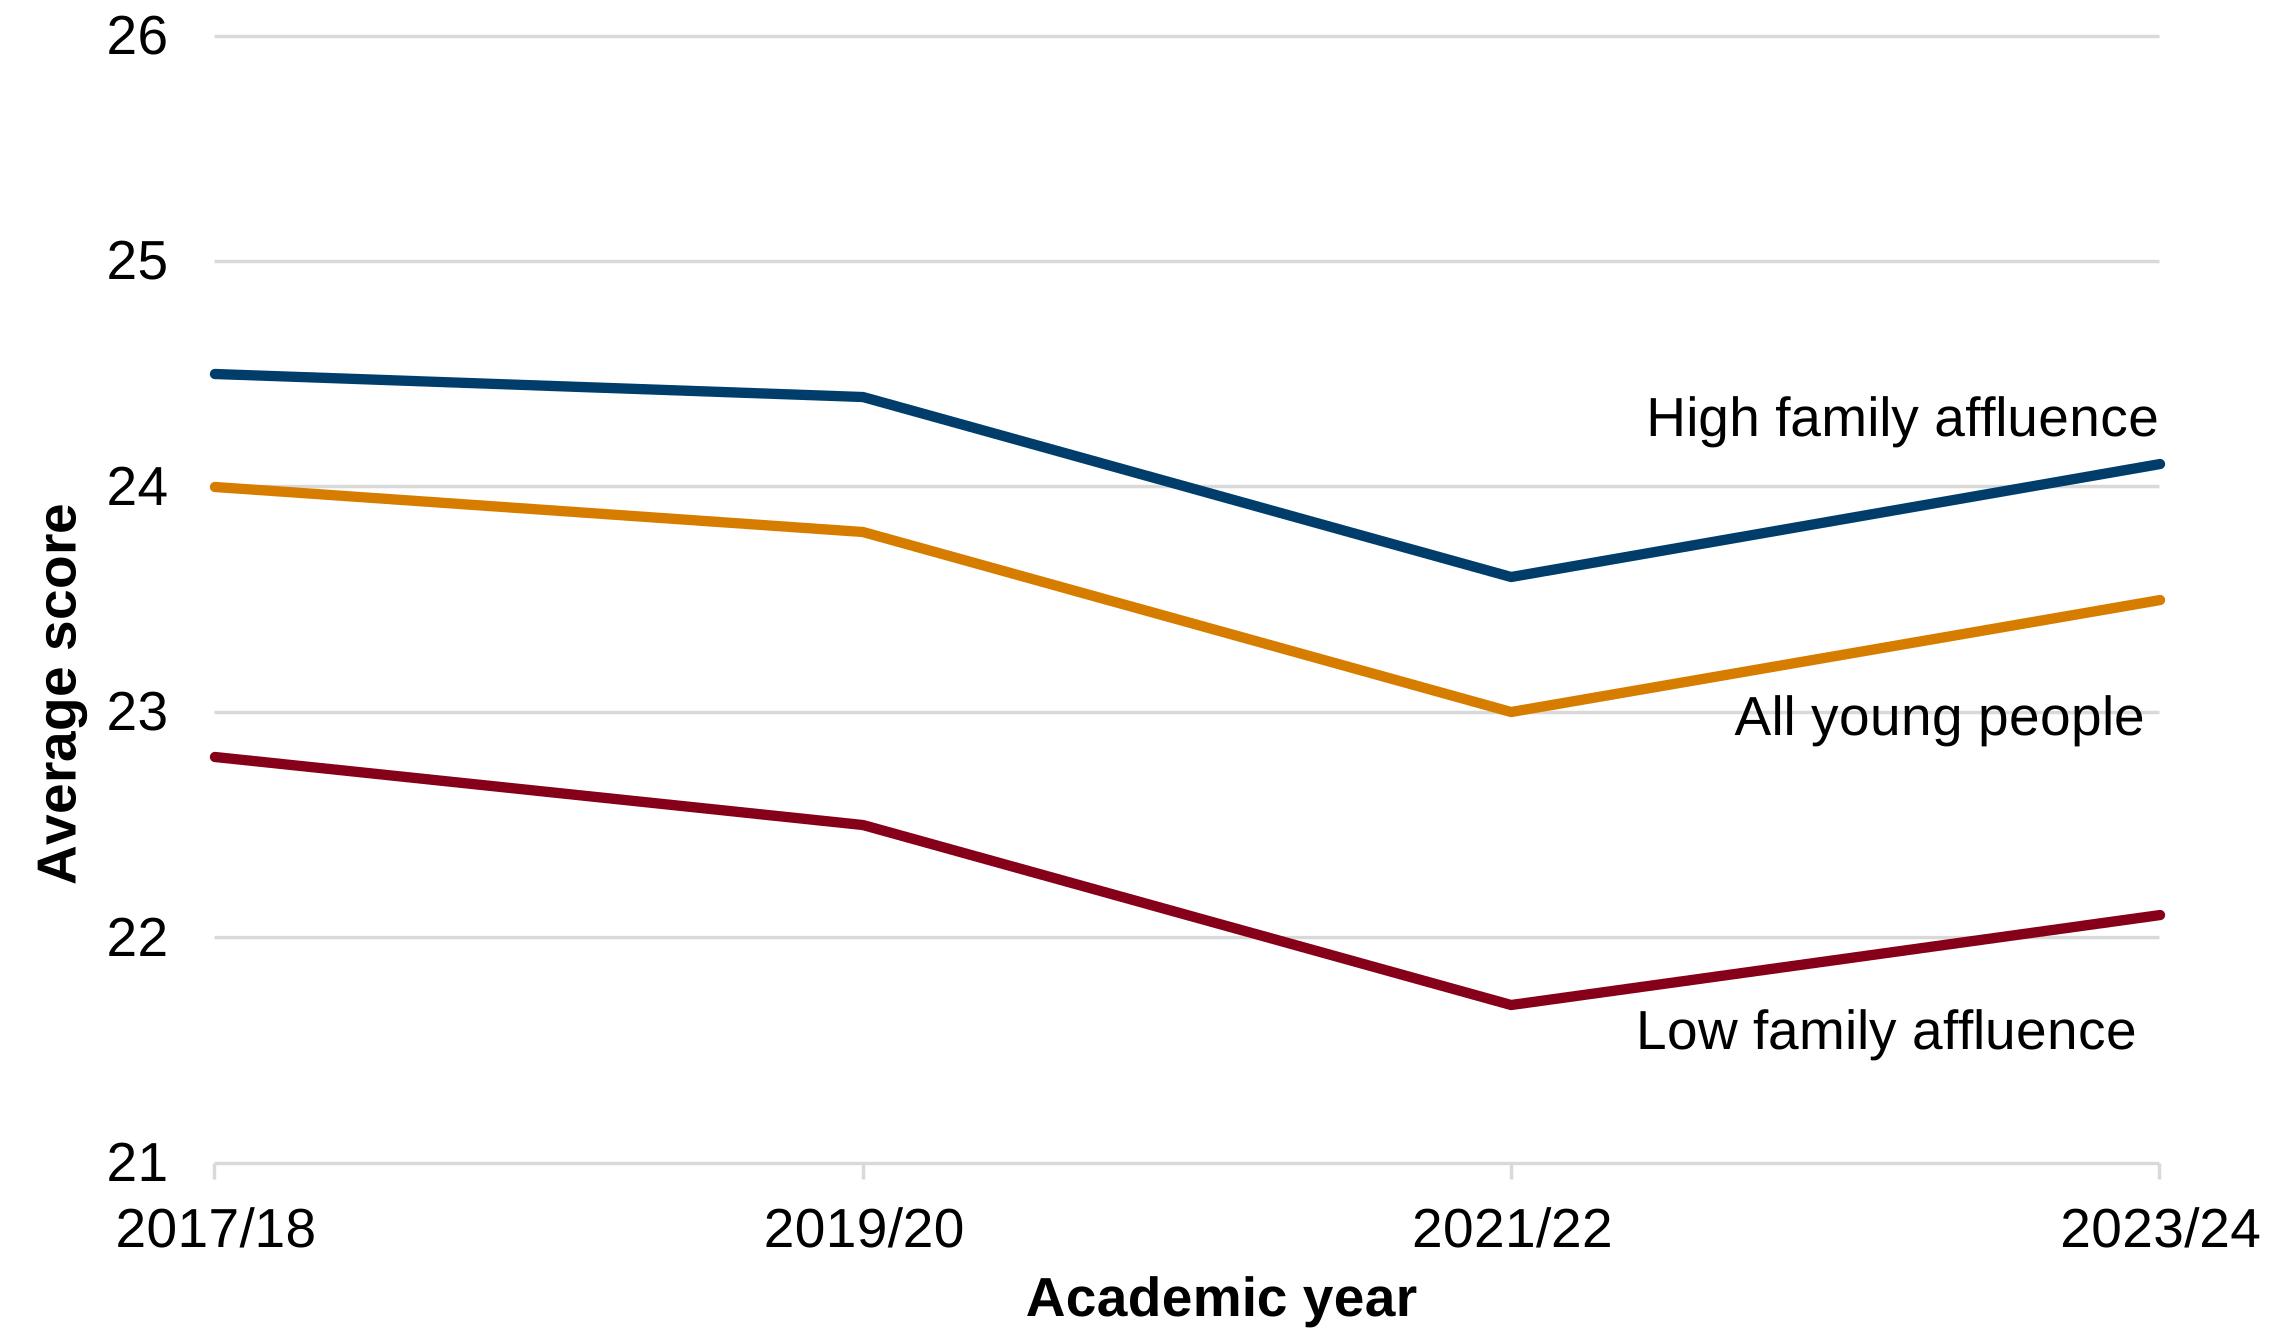
Description of figure 3.8: this line chart shows the average mental wellbeing score for young people declined between 2017 and 2024. The gap between young people from low and high family affluence has widened.
Source: School Health Research Network Student Health and Well-being Survey.
[Note 1] The y axis does not start at zero.
Hazardous housing
A range of factors influence health, including employment, air pollution, and housing. Housing conditions have improved over the decade to financial year 2017 to 2018, reducing health risks.
The most recent Welsh Housing Conditions Survey in 2017 to 2018 showed 82% of dwellings were free from serious (category 1) hazards, up from 71% in 2008, with improvements across all housing types.
Housing is also assessed using the Housing Health and Safety Rating System, mainly in the private rented sector and typically in response to complaints. As such these figures are not directly comparable with the broader Welsh Housing Conditions Survey. In 2024 to 2025, 69% of these assessments were free from category 1 hazards, broadly consistent with previous years.