
Wellbeing of Wales 2026 - A resilient Wales
A summary of progress on improving our social, economic, environmental and cultural wellbeing.
In this page
A resilient Wales
A nation which maintains and enhances a bio-diverse natural environment with healthy functioning ecosystems that support social, economic and ecological resilience and the capacity to adapt to change (for example, climate change).
Progress towards the goal
Data for some of the national indicators suggest that progress is being made towards the resilient Wales goal, but some of this progress has slowed recently, and further improvements are needed to reach the goal and national milestones.
An experimental indicator on the status of biological diversity in Wales published in 2021 showed that the distribution of a subset of priority species had stabilised in recent years following a long-term decline. But a more recent review of evidence from the State of Natural Resources Report 2025 drawing on a wider assessment of species, habitats and ecosystem resilience, indicates that biodiversity in Wales continues to decline.
Most habitat types have seen a reduction in diversity over the last 100 years, with the rate of decline increasing from the 1970s onwards. The national indicator on soil carbon for 2021 to 2023, shows that the concentration of carbon in our topsoil is generally stable, apart from in arable land and broadleaf woodland where a loss of carbon in topsoil has been observed relative to concentrations in 2013 to 2016.
The quality of our water whether in seas, rivers, streams or the ground has generally improved in recent decades. But, whilst some progress has been made in protecting and enhancing our waters, there is still a long way to go.
Air quality has improved greatly since the 1970s, but remains a risk to human health and nature.
Wales has seen decreases in waste generation and considerable improvements in the recycling rate, but we continue to use up resources faster than they can be replenished.
Installed electrical capacity from renewable energy continues to increase but at a considerably slower pace than in recent years. The installation rate for renewable energy capacity in 2024 was the highest in the last 6 years but remained lower than the peak in 2015.
The State of Natural Resources Report 2025 (SoNaRR 2025) produced by Natural Resources Wales (NRW) provides a comprehensive assessment of progress against the 4 aims of the sustainable management of natural resources. It concludes that Wales is not currently meeting these aims, and that biodiversity loss, climate change and pollution continue to reduce the resilience of ecosystems and natural resources.
Biodiversity and habitats
The national milestone on biodiversity is to reverse the decline in biodiversity with an improvement in the status of species and ecosystems by 2030 and their clear recovery by 2050.
According to the State of Nature report 2023, Wales is one of the most nature depleted countries in the world, with almost 1 out of 6 assessed species at risk of extinction.
An experimental biodiversity indicator published in 2021, and included in the Wellbeing of Wales report 2021, found that the distribution of a subset of priority species (known as ‘Section 7’) had stabilised in recent years following a long-term decline. This indicator reflects the distribution of a limited number of species rather than the overall health of biodiversity and ecosystems.
A more recent review of evidence from SoNaRR 2025 drawing on a wider assessment of species, habitats and ecosystem resilience, indicates that biodiversity in Wales continues to decline and that Welsh ecosystems are not currently resilient, despite some examples of local species recovery.
In the 2019 Wellbeing of Wales report we reported that 31% of our land was considered semi-natural. This national indicator is used to assess the proportion of our land that has semi-natural, less modified habitats as these are most likely to form healthy and resilient ecosystems. A further update of this indicator will be available by early 2027.
SoNaRR 2025 concludes that ecosystems in Wales lack resilience, with many semi-natural habitats continuing to decline in diversity, extent, condition and connectivity. The report also provides some evidence of improvement of ecosystem resilience across Woodlands and Enclosed Farmland.
Well managed soil will safeguard food production, support habitats, help manage flood risk and reduce water treatment costs. The national indicator on soil carbon for 2021 to 2023, showed that the concentration of carbon in our topsoil is generally stable, apart from in arable land and broadleaf woodland where a loss of carbon in topsoil has been observed relative to concentrations in 2013 to 2016. SoNaRR 2025 concludes that Welsh soils are generally stable but face increasing pressures from climate change, carbon loss, nutrient enrichment and compaction, highlighting the need for improved soil management and monitoring to support progress towards the national indicator on healthy soils.
Water and flood risk
The quality of our water in seas, rivers, streams or the ground is generally improving.
Water is one of Wales’s natural resources which we rely on constantly including for drinking water, the economy, industry, sustainable energy sewage treatment and agriculture. In financial year 2025 to 2026 Welsh Water and Hafren Dyfrdwy provided around 926 megalitres per day (Ml/d) of water to meet demand, with higher demand experienced during peak periods such as during hot dry weather or tourism hot spots. Private water supplies (not on mains) are estimated as 13.8 Ml/d.
Data for 2024 showed that 40% of 933 surface and ground water bodies were at good or better status. This was similar to 2021 and a 3 percentage point increase since 2015. 60% of water bodies are not at good Water Framework Directive Regulations Status. This is because of physical modifications; pollution from wastewater, towns, cities and transport, rural areas and abandoned mines; and changes to the natural flow and levels of water.
The 2024 water quality compliance assessments for the 9 Special Areas of Conservation (SAC) rivers in Wales were published in 2025, using monitoring data against targets for phosphorus and wider indicators of pollution. The SAC Rivers water quality compliance assessment results show that 50% of SAC rivers are now meeting stringent targets, compared with 39% in 2021.
Good quality bathing waters are very important for coastal communities, visitors and the economy in Wales. During the past 9 years, nearly all bathing waters met the standards set by the Bathing Water Regulations. Bathing water quality was monitored at 112 designated sites around Wales’s coast in 2025. 110 bathing waters met the standards. 78 were classified as excellent, 26 achieved good and 6 were classified as the minimum, sufficient, standard. 2 bathing waters failed to achieve the standard and were assessed as poor, the same as in 2024. Typically, the classifications are based on 4-years of bathing water quality data.
Figure 2.1: bathing water quality, percentage of designated sites, 2017 to 2025 [Note 1]
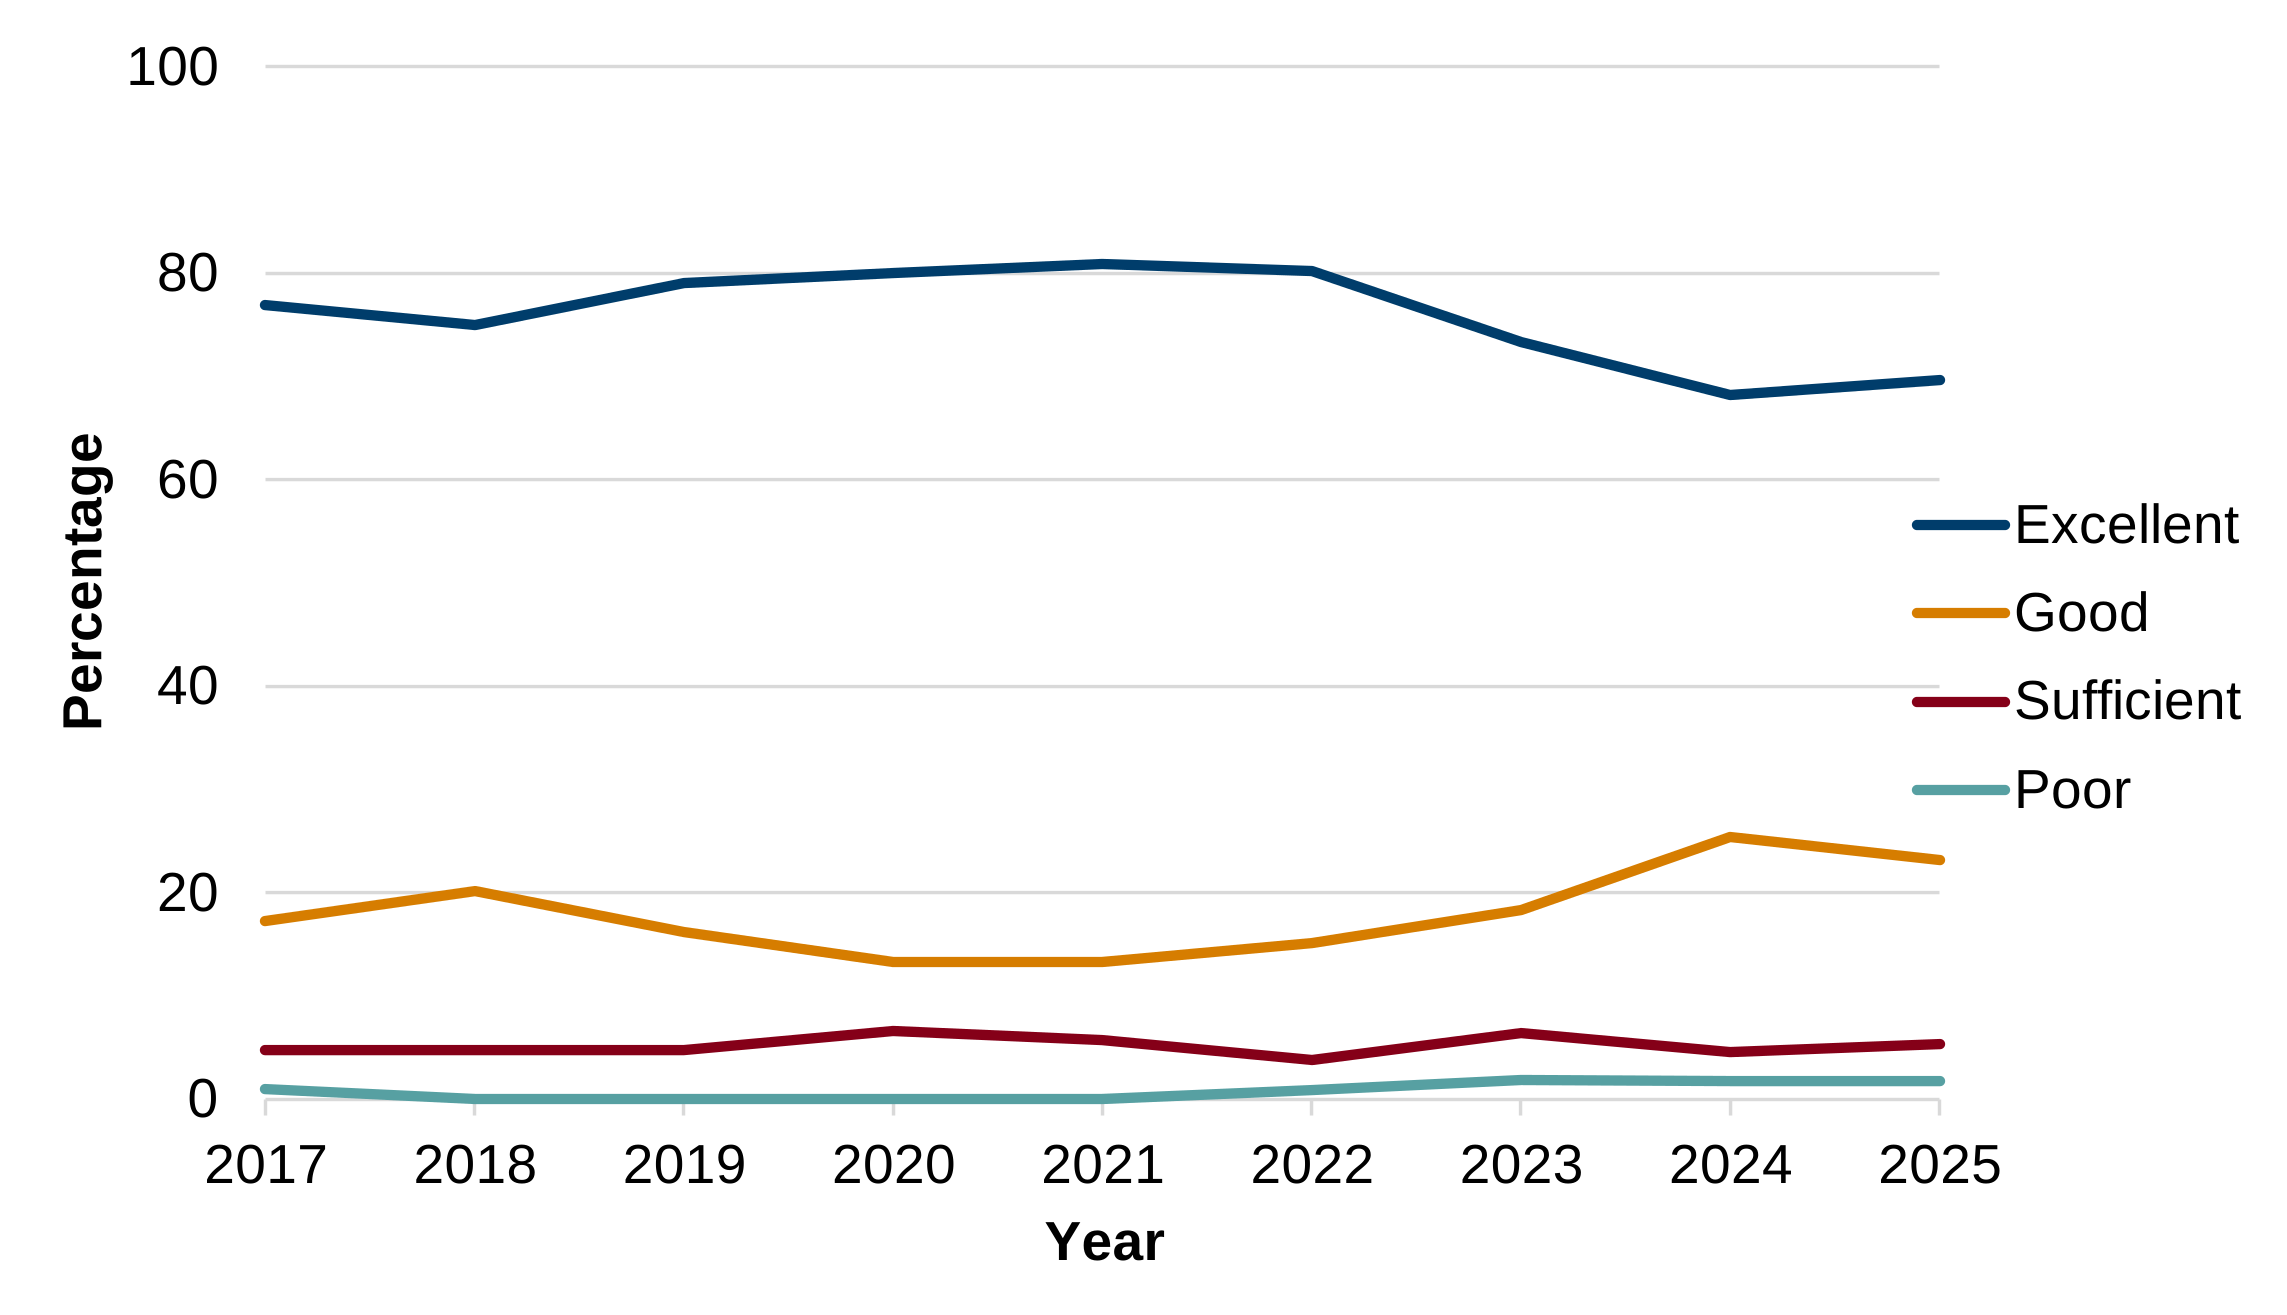
Description of figure 2.1: a line chart showing bathing water quality for designated sites in Wales between 2017 and 2025. In 2025, 70% were classed as excellent (the lowest percentage since 2017), 23% as good, 5% as sufficient and 2% as poor.
Source: NRW Bathing Water Quality Report 2025
Note 1: Typically, the classifications are based on 4-years of bathing water quality data
Data published in 2025 showed that 1 in 7 (275,000) residential and non-residential properties were at either low, medium or high risk of flooding. In terms of the national indicator on flooding, nearly 49,000 properties in Wales were at high or medium risk of flooding from rivers and over 80,000 properties at high or medium risk of tidal flooding. Of these, nearly 26,000 benefit from river flood defences, nearly 42,000 from tidal flood defences and nearly 35,000 benefit from river and sea flood defences.
Air quality
Air quality has improved greatly since the 1970s, but remains a risk to human health.
The national indicator on nitrogen dioxide (NO2) shows that overall, the average concentration levels to which people are exposed have been declining over the past decade. After a period of relative stability between 2017 and 2019 (at around 9 µg/m3), the average concentration decreased to 7 µg/m3 in 2020 and 2021, rising slightly to 8 µg/m3 in 2022 before decreasing gradually to 6 µg/m3 by 2024. Average concentrations to which people are exposed of particulate matter (PM10) continued to decrease in 2024 with PM2.5 remaining broadly similar.
SoNaRR highlights that nitrogen pollution continues to exceed critical thresholds across many sensitive habitats, contributing to biodiversity loss and ecosystem degradation, while emissions from transport, agriculture, industry and domestic burning still affect air quality in some areas.
Air pollution has a significant effect on public health. In 2022, the UK Health Security Agency estimated that long-term outdoor air pollution contributed to the equivalent of between 29,000 and 43,000 deaths (at typical ages) per year in the UK. Public Health Wales estimated the burden of long-term air pollution exposure to be around the equivalent of 1,000 to 1,400 deaths in Wales each year. This does not reflect ‘actual’ deaths from air pollution exposure, but is an estimate of the ‘equivalent’ reduced life expectancy, when summed, which everyone experiences because of air pollution exposure.
Figure 2.2: air quality indicators, 2007 to 2024
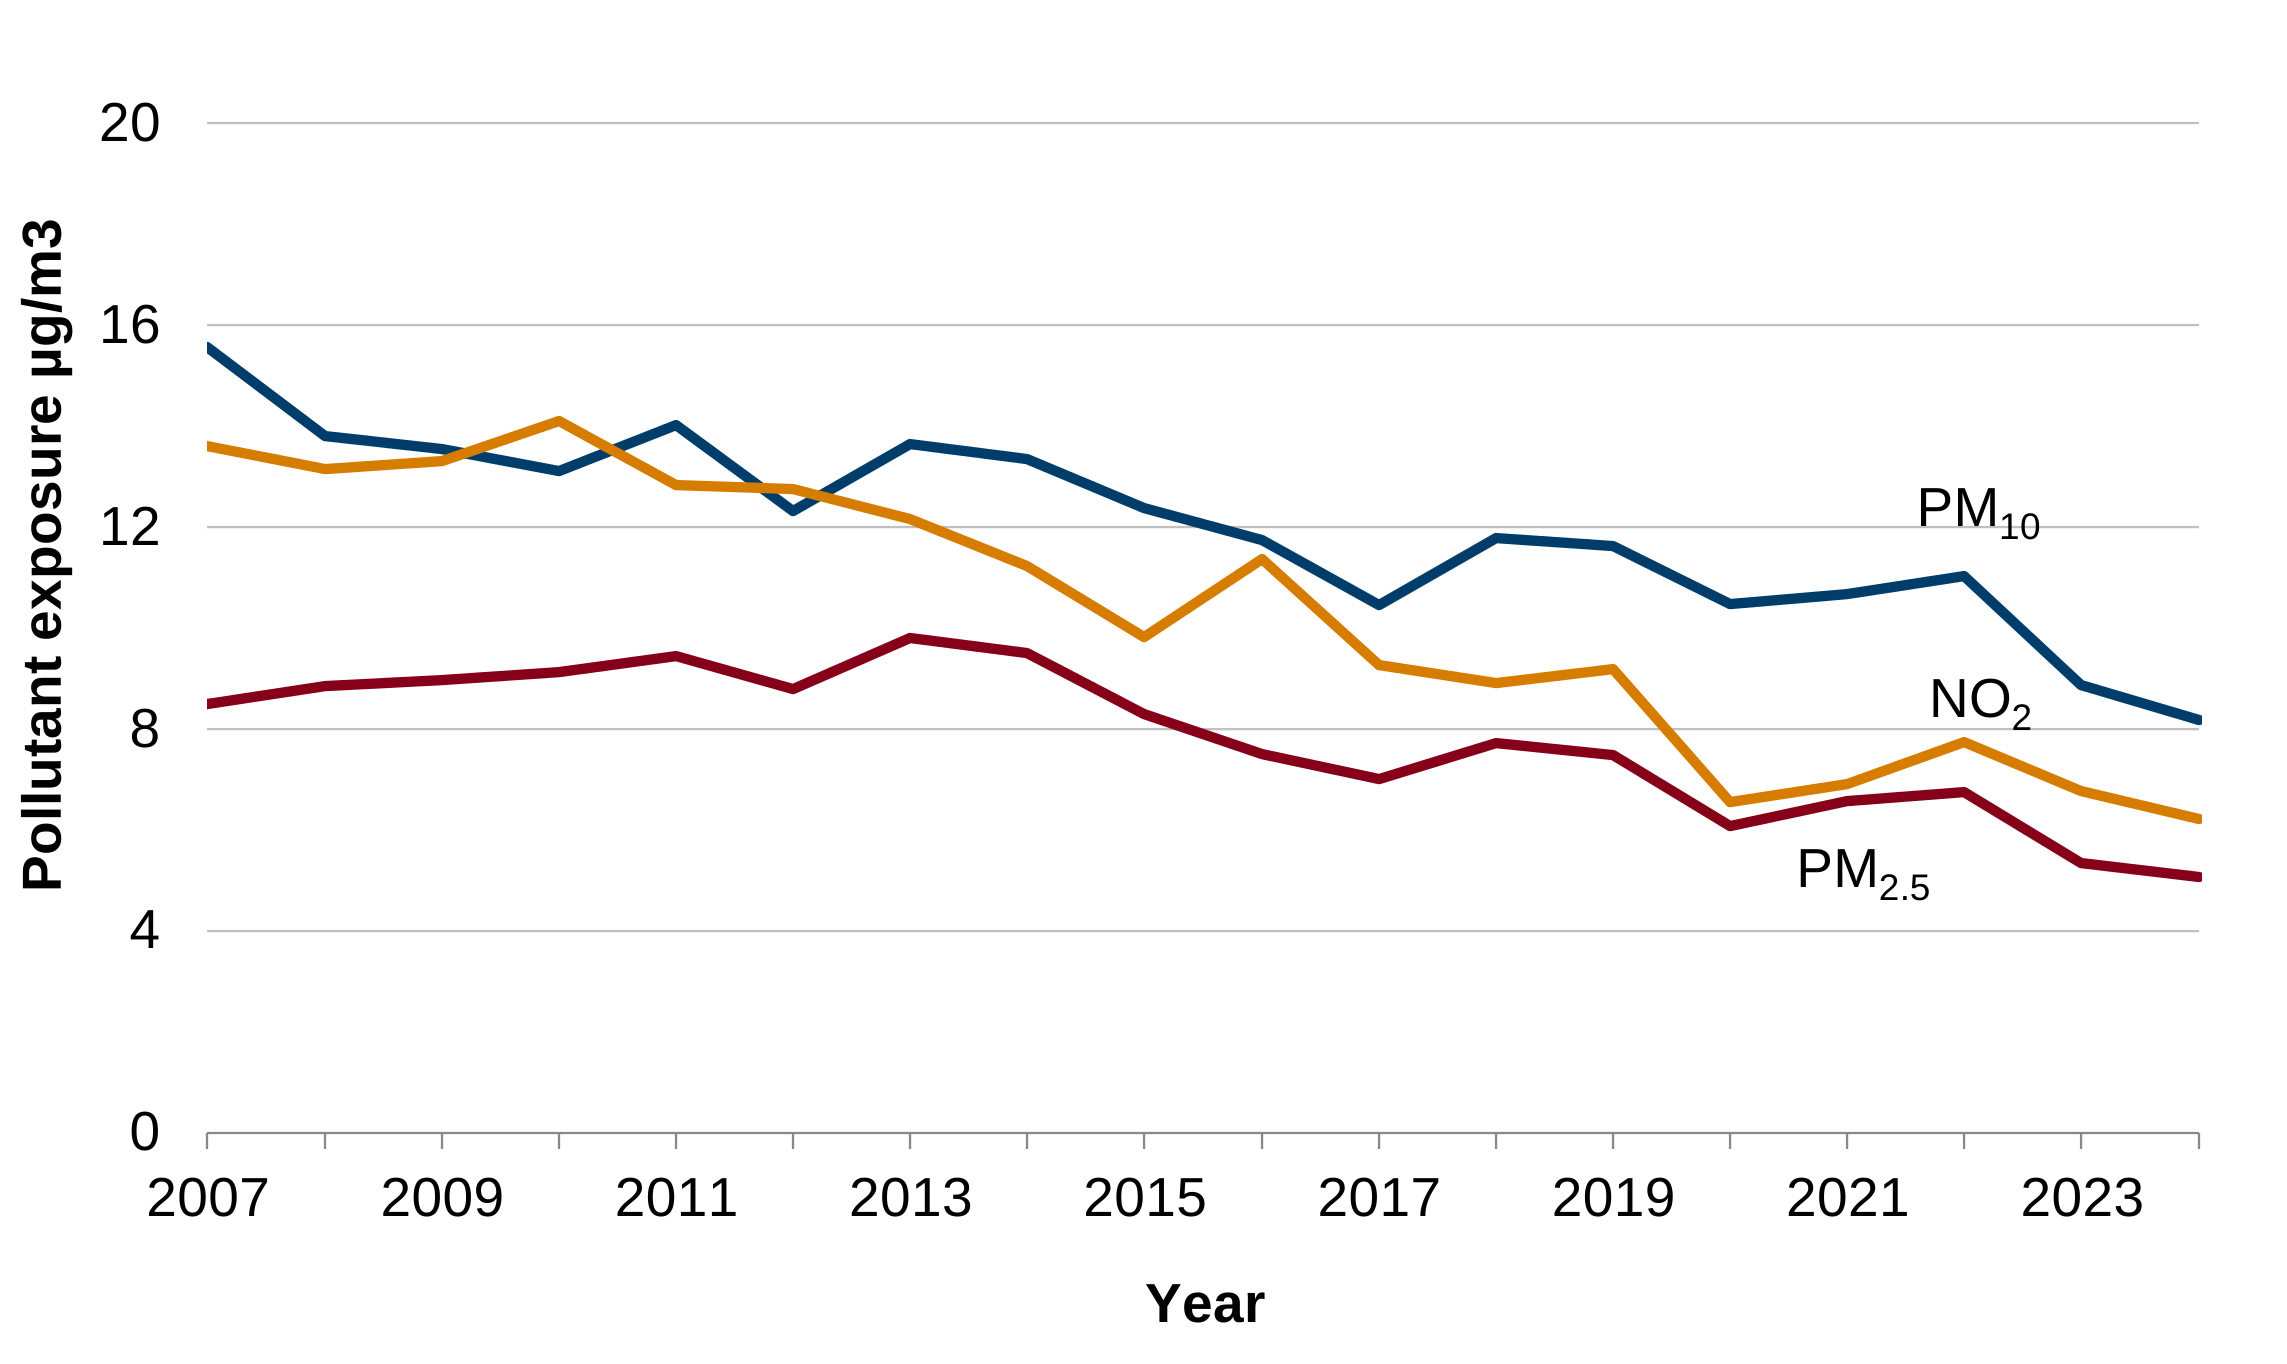
Description of figure 2.2: a line chart showing a general improvement in air quality indicators over the period 2007 to 2024.
Source: Air Quality Emissions Indicators
Waste and recycling
Wales has made considerable progress in managing waste over the last decade by increasing the amount sent for recycling, and reducing the amount sent for disposal. Wales is a world leader in household recycling, but we continue to use up resources faster than they can be replenished.
There was a considerable decrease in the amount of waste generated, that is not recycled, per person, between 2012 and 2019 (from 794kg to 523kg). The amount of waste not recycled decreased for each of the 3 components that comprise this national indicator:
- household waste
- industrial and commercial waste
- construction and demolition waste
Whilst the industrial and commercial, and the construction and demolition waste components are measured periodically through surveys, more regular and up-to-date data is available on household waste.
The amount of household waste generated but not recycled per person has generally decreased over the last decade, apart from small increases during the COVID-19 pandemic. In financial year 2024 to 2025, on average 163kg of household waste generated was not recycled per person a decrease from 168kg the previous year.
The recycling rate (i.e. the percentage of local authority municipal waste that was reused, recycled or composted) has increased considerably during the last two decades, from around 5% in the late 1990s to over two-thirds (68.4%) in 2024 to 2025.
Figure 2.3: percentage of local authority municipal waste reused, recycled or composted, between financial years 2013 to 2014 and 2024 to 2025
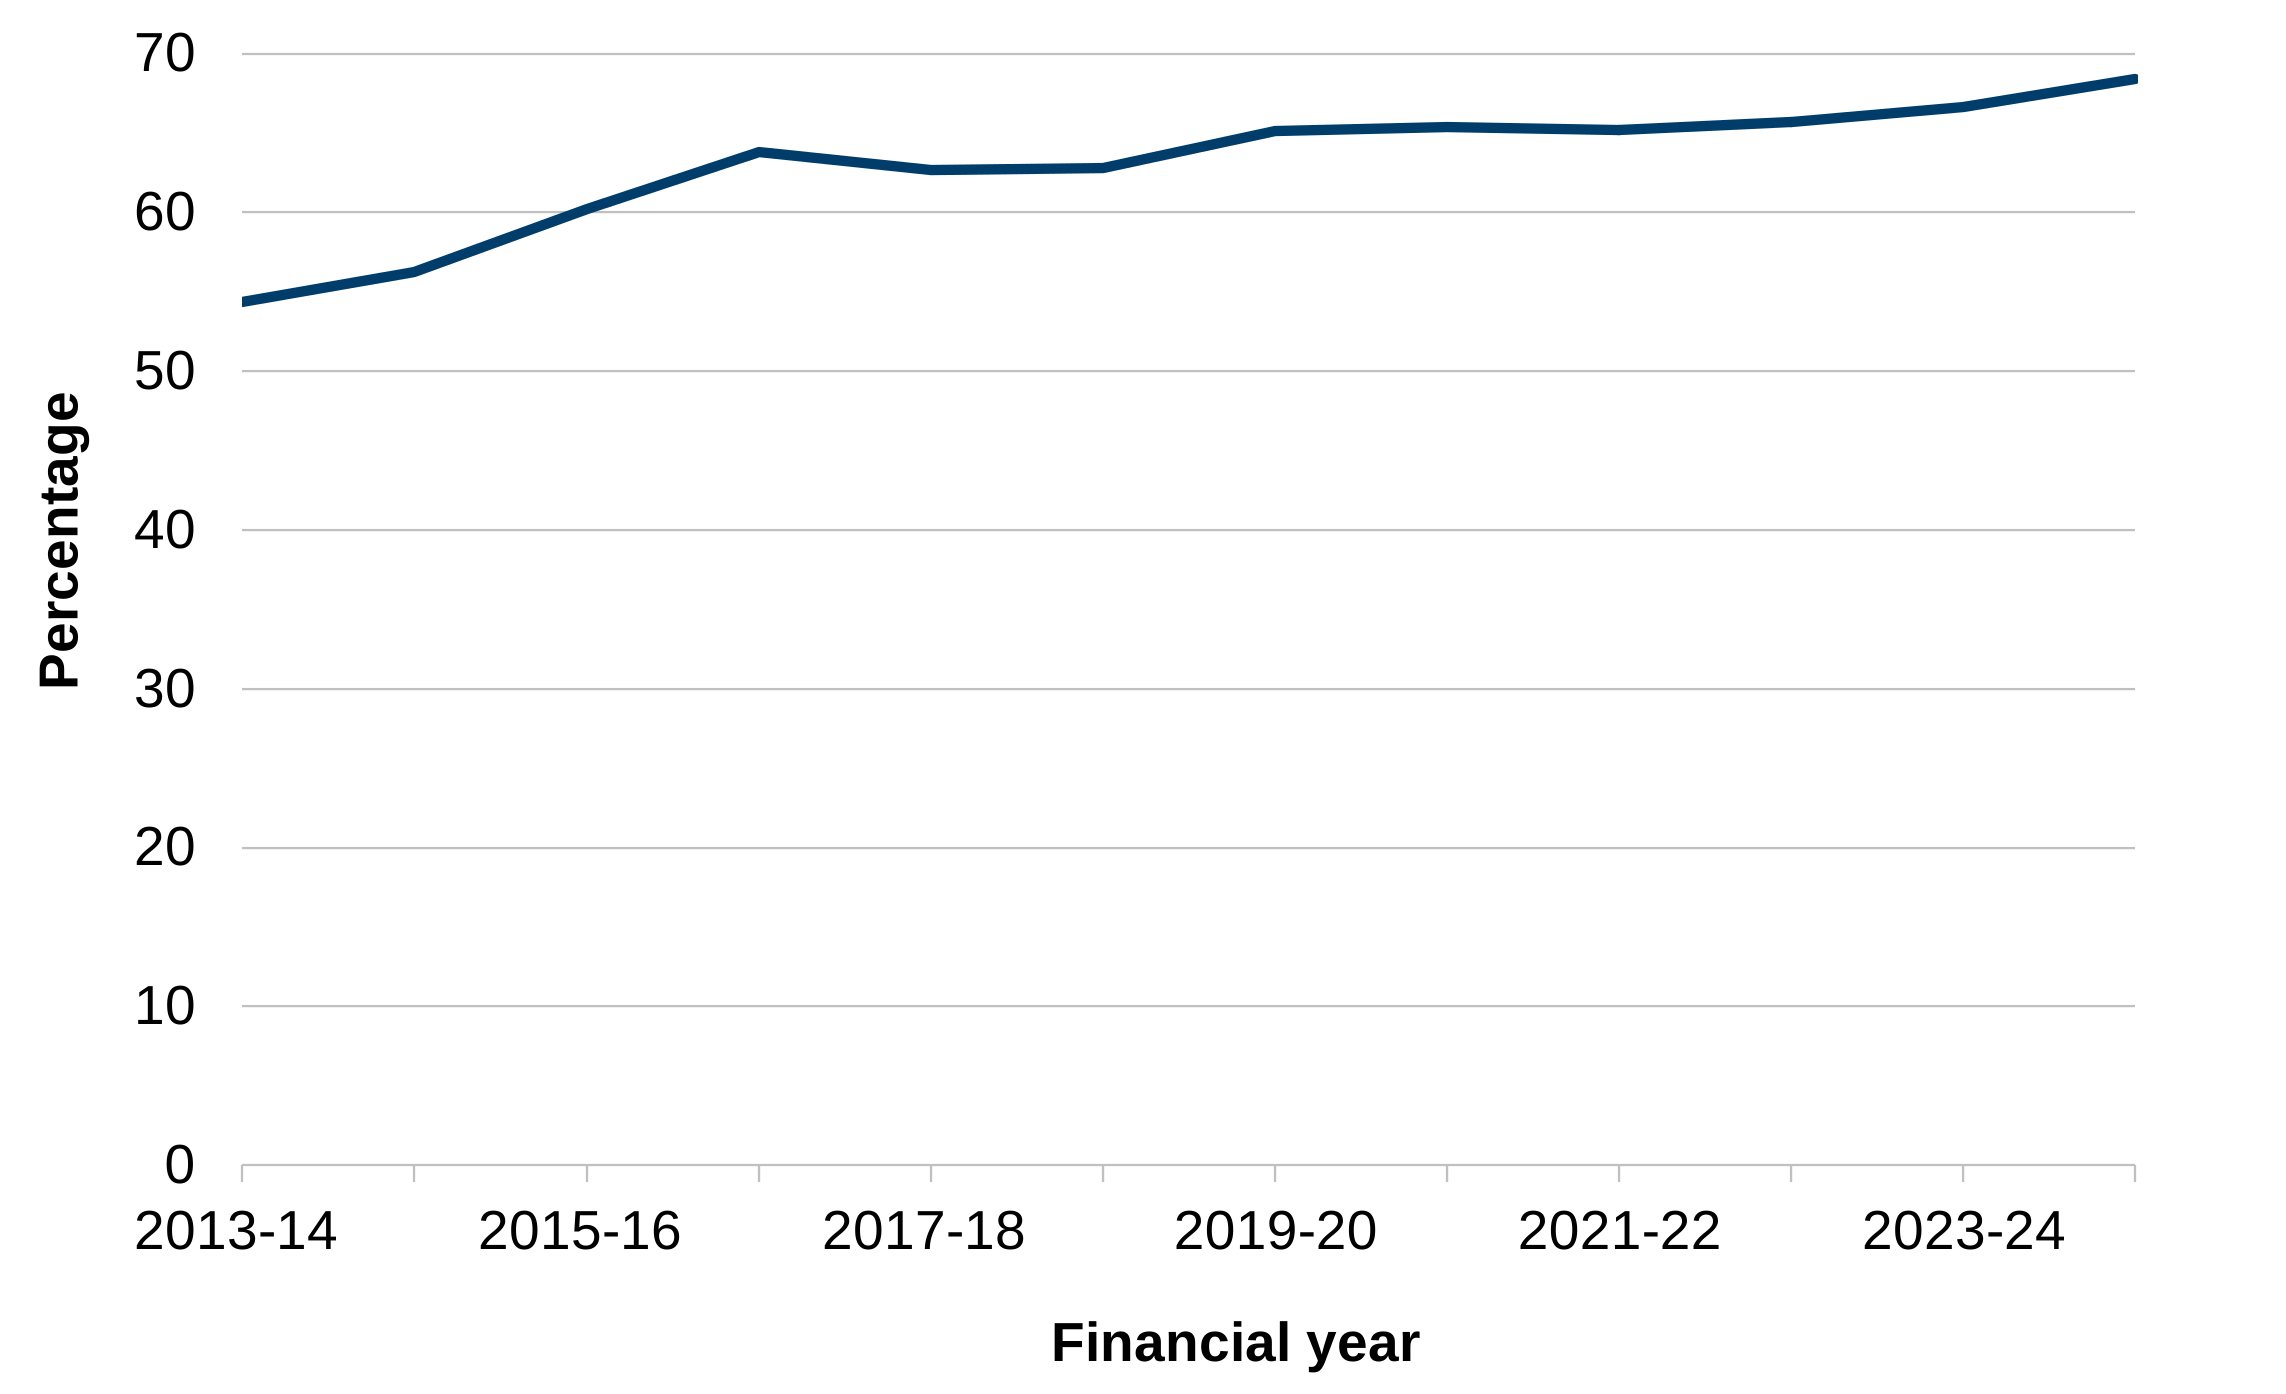
Description of figure 2.3: a line chart showing that the percentage of municipal waste reused, recycled or composted in Wales generally increased from 54.3% in 2013 to 2014 to 68.4% in 2024 to 2025.
Source: Local Authority Municipal Waste, StatsWales
Renewable energy generation
Over a third (37%) of electricity generated in Wales was from renewable sources in 2024, up from 34% in 2023, due to falling fossil gas generation. In 2024, renewable electricity generation in Wales was estimated to be equivalent to 55% of its electricity consumption, including losses.
The national indicator on renewable energy relates to renewable energy generation capacity (electrical and heat). This has increased considerably over the last decade, though progress has slowed in recent years. At the end of 2024, the installed electrical capacity for renewable energy was 3,809 megawatts (MW), a 4% increase compared to the previous year and more than twice the capacity in 2012. At the end of 2024, the total renewable heat capacity in Wales was 956 MW, 10% more than the previous year and nearly 16 times the heat capacity in 2012. The installation rate for renewable energy capacity in 2024 was the highest in the last 6 years but remained lower than the peak in 2015.
Wales remains a net exporter of electricity to the rest of the UK, Ireland and the wider European electricity network.
Figure 2.4: renewable energy generation capacity, 2012 to 2024
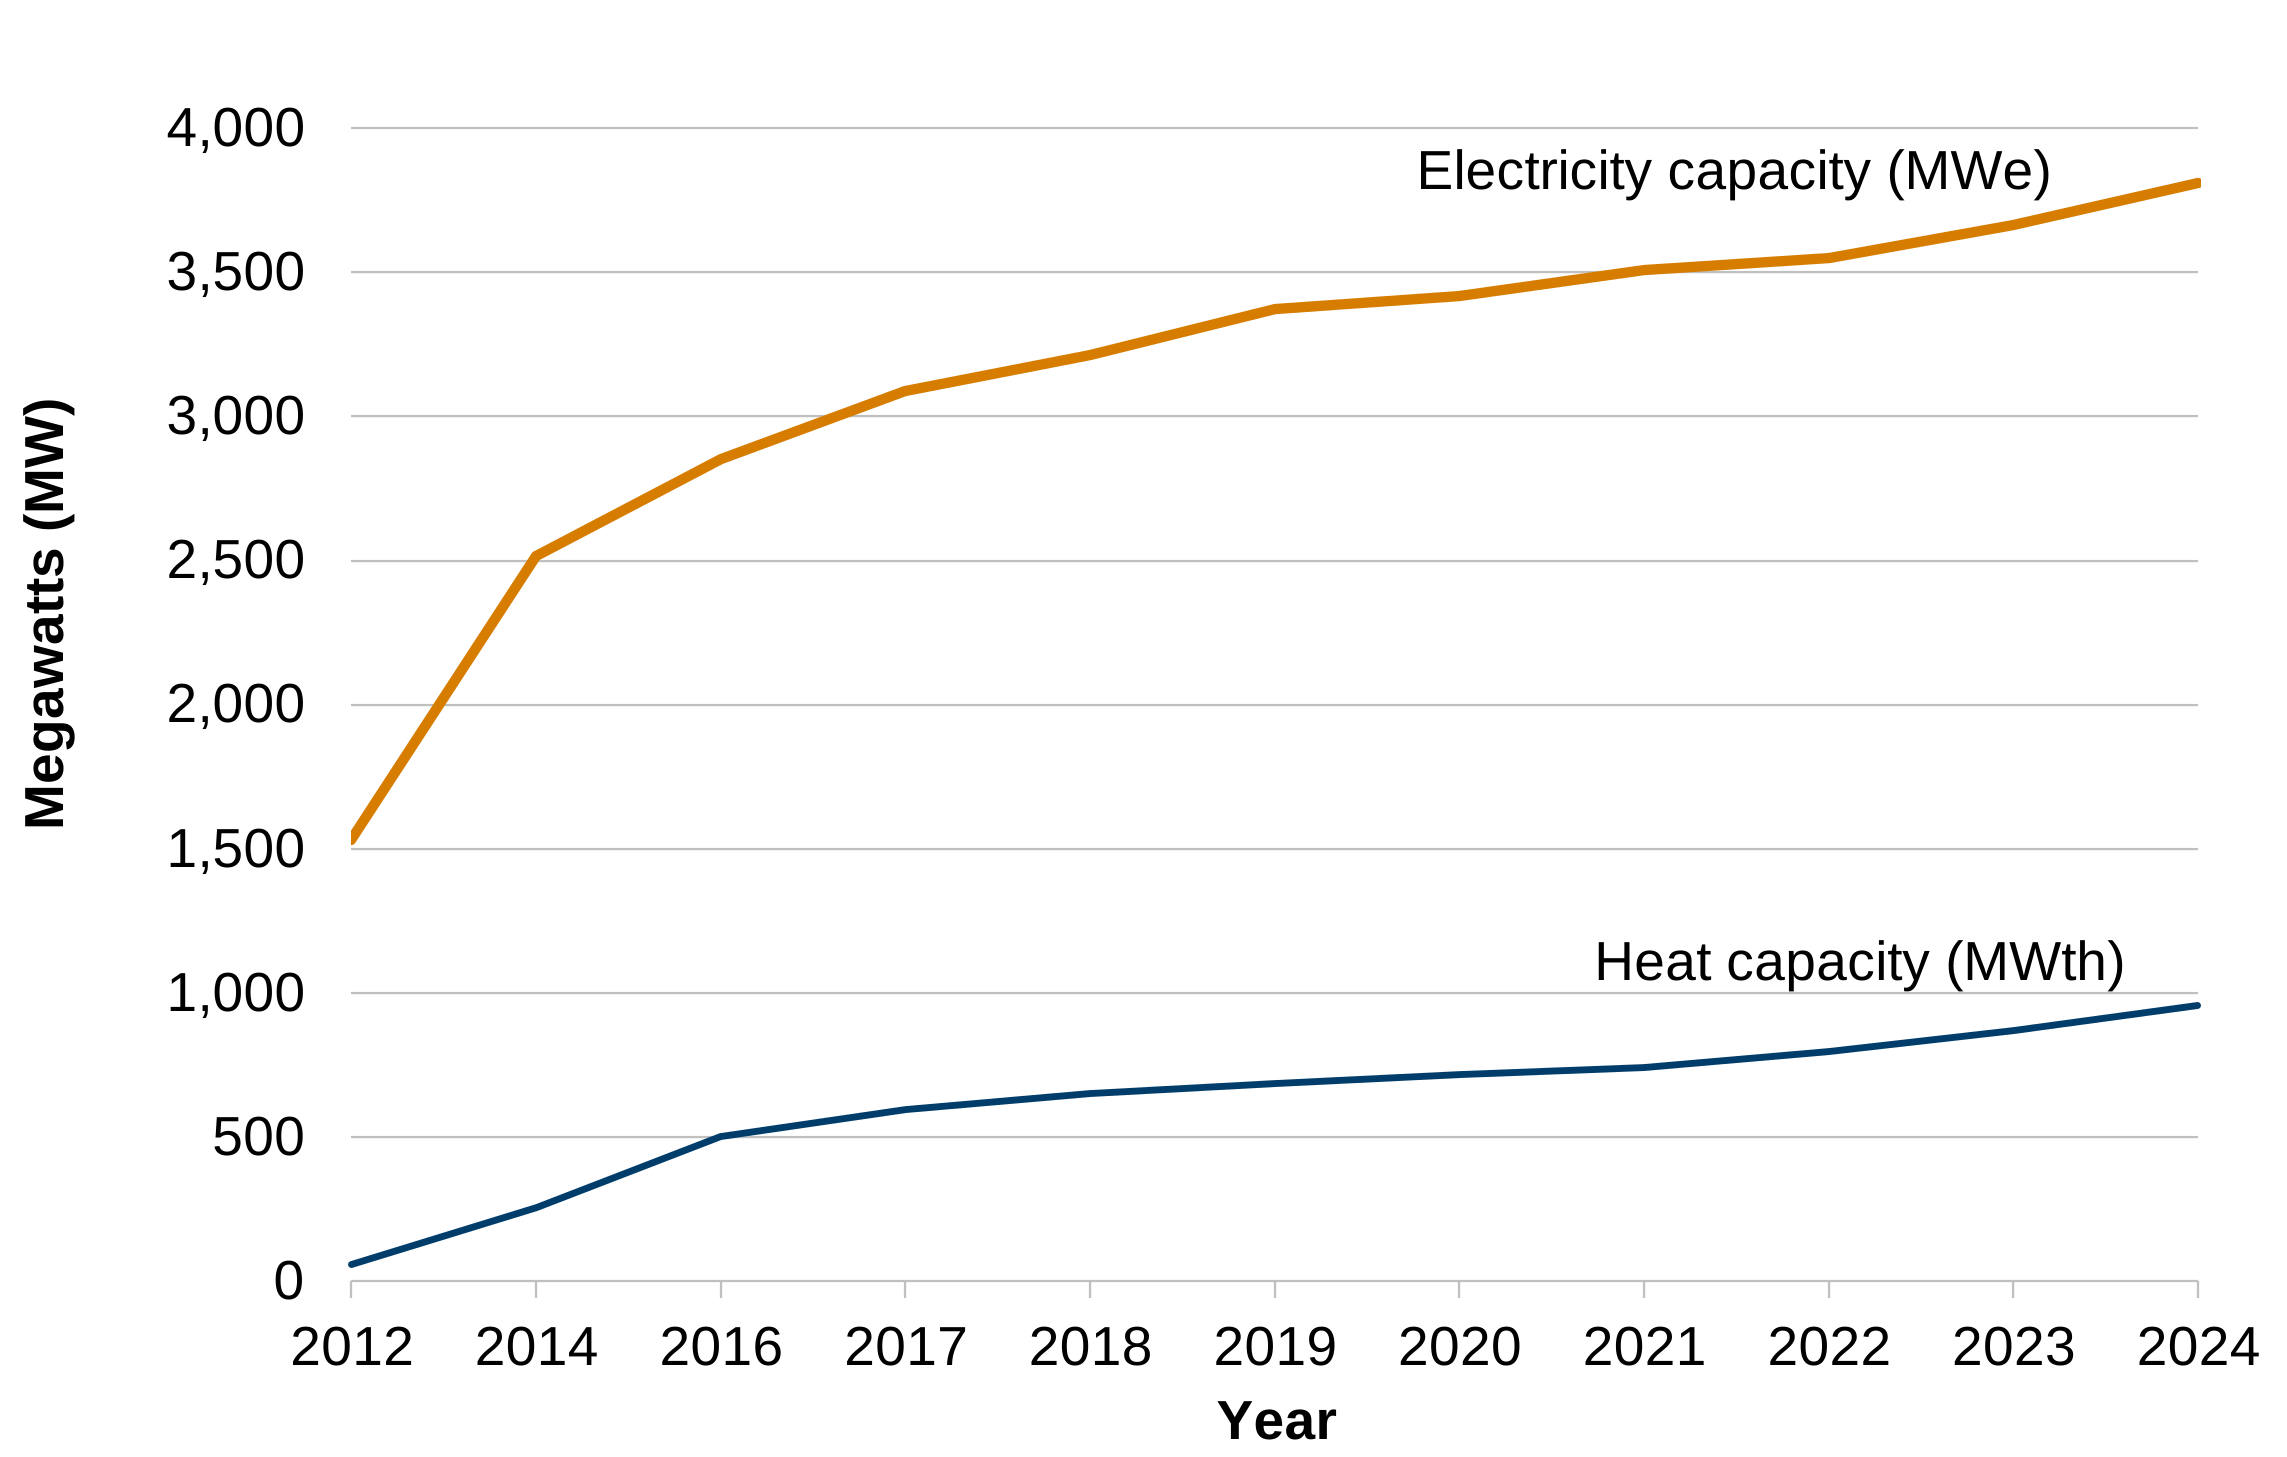
Description of figure 2.4: a line chart showing an overall considerable increase in both renewable electrical and heat capacity in Wales between 2012 and 2024, with the increase slowing in recent years.
Source: Energy Generation in Wales report
The national milestone on dwelling energy performance is that all homes in Wales will have adequate and cost-effective energy performance by 2050. According to the Welsh Housing Conditions Survey, financial year 2017 to 2018, 47% of residential dwellings were considered to have adequate energy performance (a SAP rating of 65 or above).
Further reading
Previous versions of the Wellbeing of Wales report include further analysis of:
- flooding
- semi-natural habitats
- biodiversity
- green spaces
- quality of soil
- energy efficiency of homes
State of Natural Resources Report 2025 (Natural Resources Wales) provides a comprehensive assessment of the extent to which natural resources are being sustainably managed. The new SoNaRR evidence portal (Natural Resources Wales) includes the evidence behind the Ecosystem Resilience Assessment.
Wales Environmental Information Portal (Natural Resources Wales)
State of Nature report for Wales (State of Nature Partnership)