
Wellbeing of Wales 2026 - A prosperous Wales
A summary of progress on improving our social, economic, environmental and cultural wellbeing.
In this page
A prosperous Wales
An innovative, productive and low carbon society which recognises the limits of the global environment and therefore uses resources efficiently and proportionately (including acting on climate change); and which develops a skilled and well-educated population in an economy which generates wealth and provides employment opportunities, allowing people to take advantage of the wealth generated through securing fair work.
Progress towards the goal
Longer term progress towards this goal has been mixed. Overall labour market outcomes have improved compared with the period prior to devolution in 1999. Progress has been less marked in addressing poverty, low productivity, pay and income levels. Whilst progress has been made on decarbonisation, more rapid change will be needed in future to meet targets.
Economic performance has been mixed over the last year. Economic data continues to suggest the economy in Wales is performing in a similar manner to the wider UK economy.
The labour market has weakened with job losses more concentrated in private sector industries.
Welsh economic performance continues to be weaker than the UK as a whole in terms of economic output (gross value added) and household income (for both gross disposable household income and median household income) per head but is broadly similar to some other parts of the UK with similar features and characteristics.
Average household incomes in Wales are considerably closer to the UK average than gross value added (GVA) per head. Differences depend on the measure used and with the gap smallest when assessed using the middle household (or median) which is considered a more typical household for comparisons.
The historical gaps in employment and activity rates between Wales and other parts of the UK have narrowed since the turn of the century, with Wales outperforming some English regions over the medium term. This represents a marked change from the period prior to devolution in the 1980s and 1990s.
Wales has a higher percentage of people earning less than the real living wage than some other parts of the UK. In addition, the evidence on other aspects of the quality of work and pay gaps suggests a mixed picture in Wales.
Provisional estimates for 2024 show that the proportion of 16 to 24 year olds who were in education, employment or training (86.3%), is approaching the 90% national milestone, up from around 80% in the period 2010 to 2012.
The qualification profile of the Welsh working age population has been improving over time, moving towards the relevant milestones, with an increase in the proportion of working age adults with level 3 (equivalent to A levels) and level 4 qualifications (equivalent to degree level) in the last decade whilst the proportion with no qualifications decreased.
Attainment in secondary schools rose in the years before the pandemic. Data for the academic year 2024 to 2025, 2 years after a full return to pre-pandemic examination arrangements, shows a small decrease in the headline measure (the Capped 9 indicator) since 2023 to 2024 and since the year prior to the pandemic (2018 to 2019). Children from deprived backgrounds still have poorer outcomes.
Since the 2008 recession, investment in business innovation in Welsh firms has fluctuated, with some improvement in businesses being actively innovative recorded prior to the pandemic.
Economic performance
Since the 2008 Global Financial Crisis, economic growth across the UK, and including Wales, has been weaker than in the preceding decade, largely reflecting subdued productivity growth. Productivity has also grown more slowly in the UK than in many other advanced G7 economies, as discussed in the Wales Economic and Fiscal Report 2025. This matters because stronger productivity enables an economy to produce more output from the same level of inputs, thereby supporting higher living standards.
Over this period, Wales has broadly kept pace with the UK in growth. However, the labour productivity gap measured by Gross Value Added (GVA) per hour between Wales and the UK has persisted at around 15%. In 2023, Wales recorded the lowest level of labour productivity among the UK countries and English regions, reflecting long-standing structural challenges that need to be addressed if the gap is too narrow. Reducing productivity gap between Wales and the wider UK is therefore a key priority. In this context, the Welsh Government has recently set an ambition to halve the productivity gap between Wales and the rest of the UK within 10 years.
Figure 1.1: gross value added (GVA) per hour worked, Wales regions relative to the UK (UK = 100), 2004 to 2023 [Note 1], [Note 2]
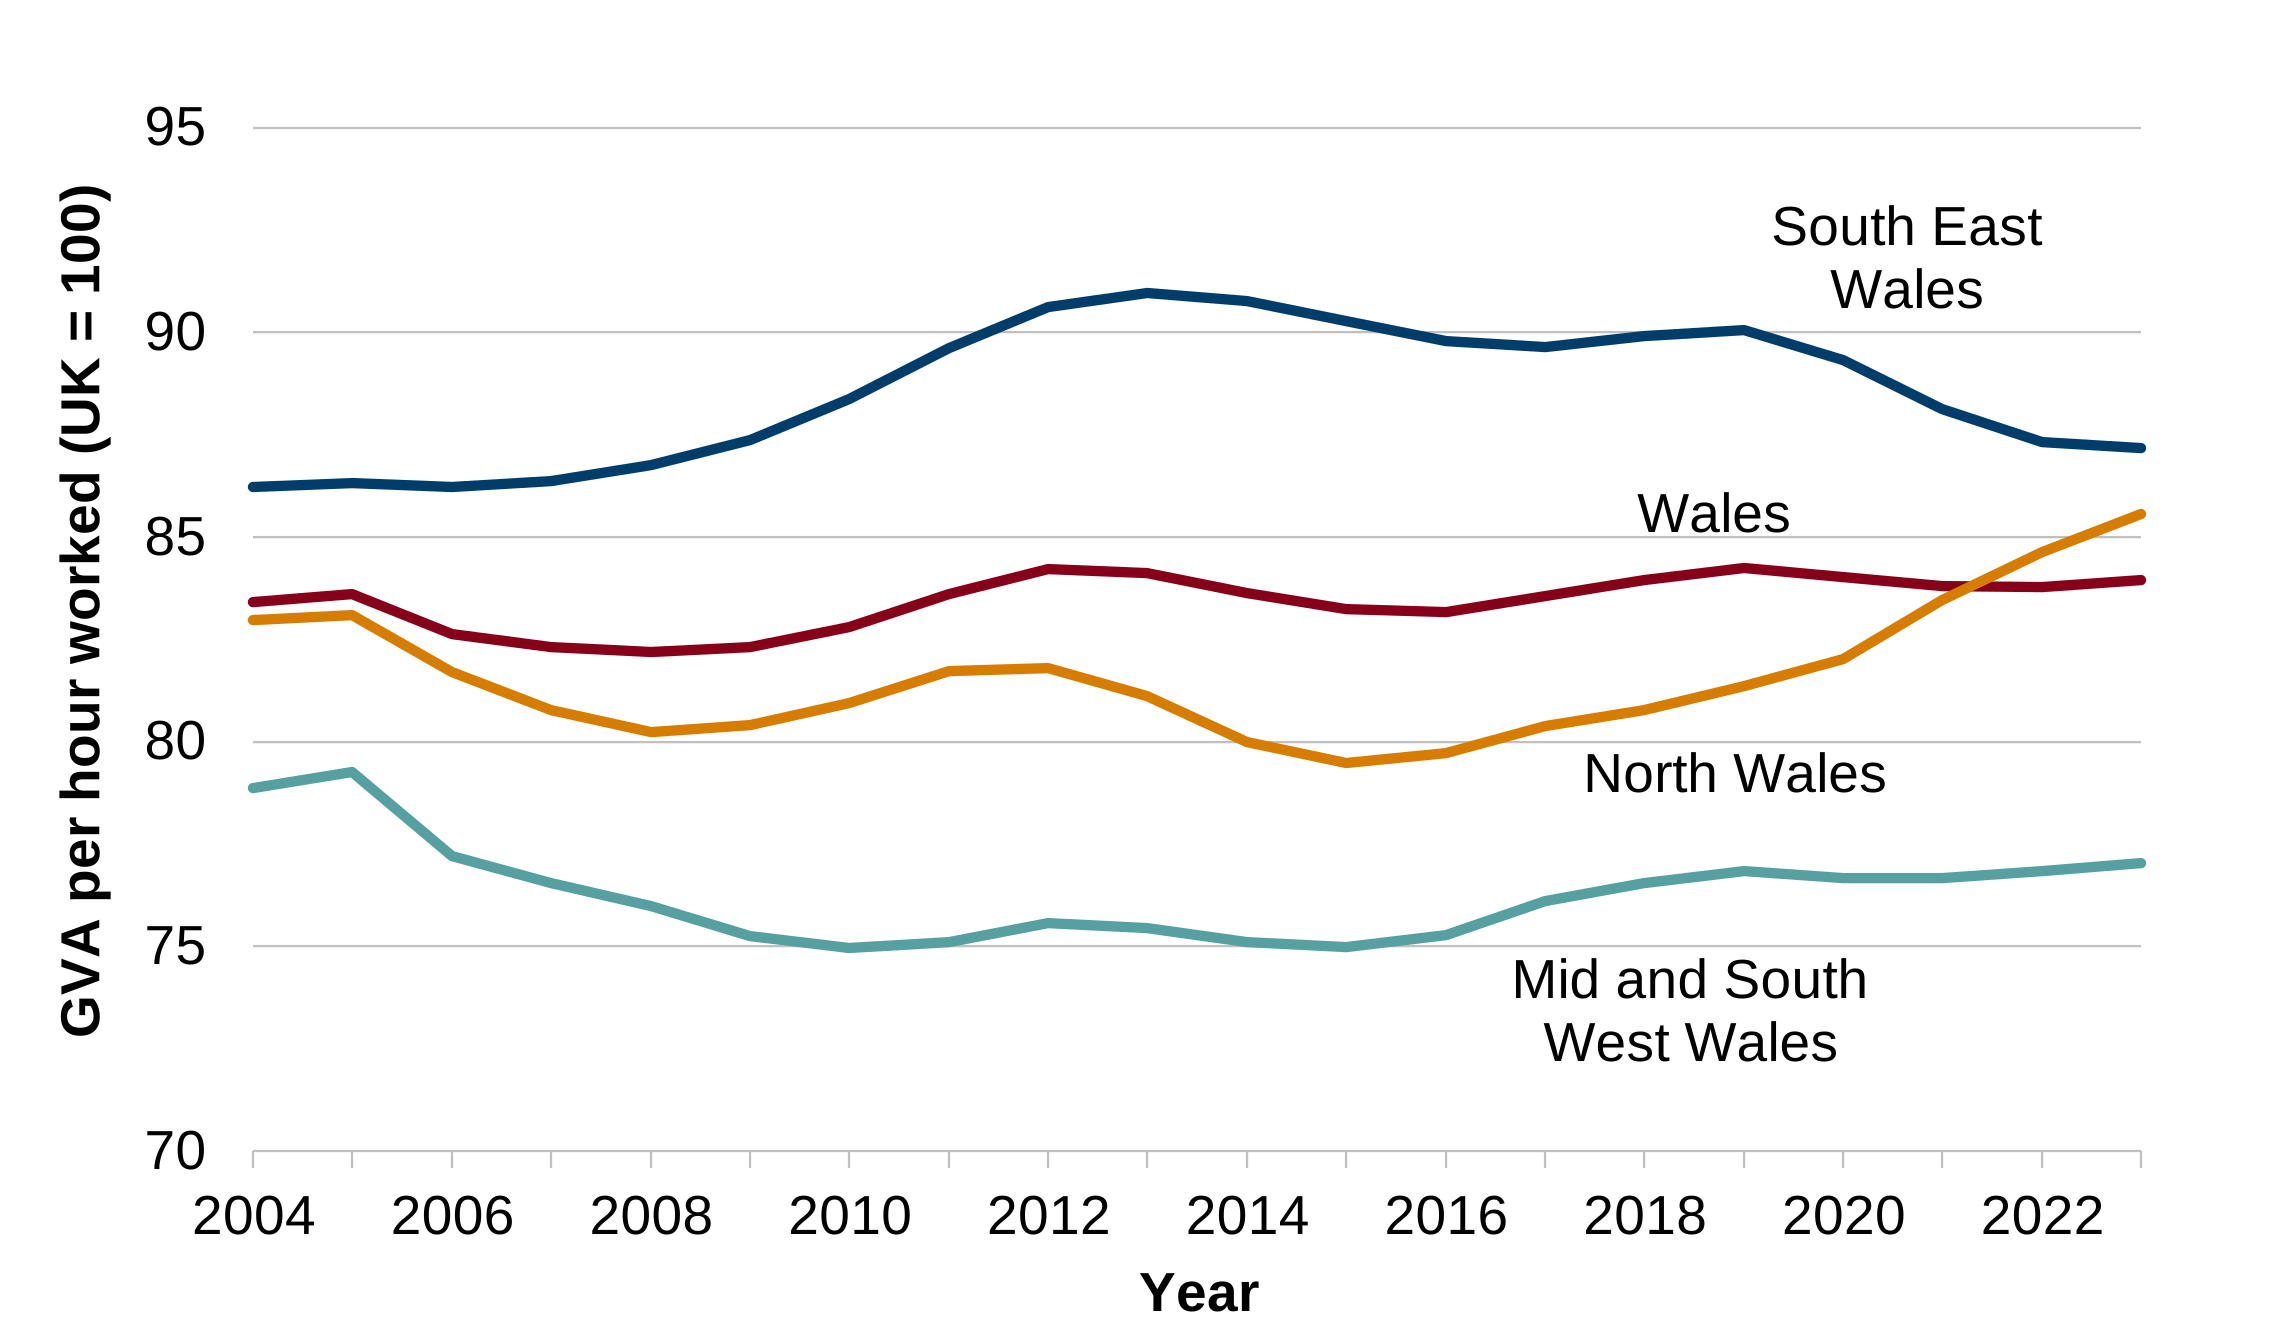
Description of figure 1.1: line charts showing that Gross Value Added (GVA) per hour worked in Wales and its economic regions relative to the UK (current index UK = 100). For Wales overall, it has been relatively stable since 2004, with Welsh productivity remaining below the UK average.
Source: Welsh Government analysis of subregional labour productivity, UK, 2004 to 2023, ONS
[Note 1] Chart axis does not start at zero.
[Note 2] Productivity estimates provided use smoothed data to account for the increased volatility that can occur at smaller geographical areas.
Labour productivity varies substantially across Wales. Productivity has consistently been highest in Southeast Wales and lowest in Mid and Southwest Wales, while North Wales has shown some signs of narrowing the gap with both Southeast Wales and the UK average in recent years. The regional productivity patterns in Wales are discussed further in the Socio-economic Analysis of Wales, 2026 Report. The report also identifies several potential factors associated with the productivity gap, including the prevalence of smaller and relatively less productive firms, a lower share of high-growth firms, low levels of R&D expenditure, a lower proportion of innovation-active businesses, and a higher share of the labour force with lower qualification levels compared to their UK average. The analysis also considers a range of measures that could support productivity growth, including supporting high-potential start-ups and spinouts, improving firms’ access to finance, increasing research, development and innovation (RD&I), strengthening skills, and raising labour market participation, including by reducing economic inactivity across gender, ethnicity and disability groups.
Innovation in businesses
One of the National Wellbeing Indicators relating to productivity growth is the proportion of innovation active businesses. The latest information from the UK innovation survey (which is published every two years with the latest data for 2022 to 2024) indicates that 28% of Welsh businesses are innovation-active (based on an Organisation for Economic Co-operation and Development (OECD) definition). This means that they are undertaking activities such as introducing new or significantly improved products, services, processes; or business structures or practices; or investing in research and development or training.
Wales had the lowest proportion of innovative firms of the UK countries and English regions over 2022 to 2024. This uses the geographic location based on businesses’ head office location. It is unclear how much of an effect this may have on measuring innovation in Wales.
Since the 2008 recession, investment in business innovation has fluctuated in Wales and the UK. The proportion of innovation active businesses have declined since COVID-19 (2020 to 2022) across most UK regions, except the East Midlands.
Figure 1.2: innovation-active businesses in Wales and the UK, between 2008 to 2010 and 2022 to 2024
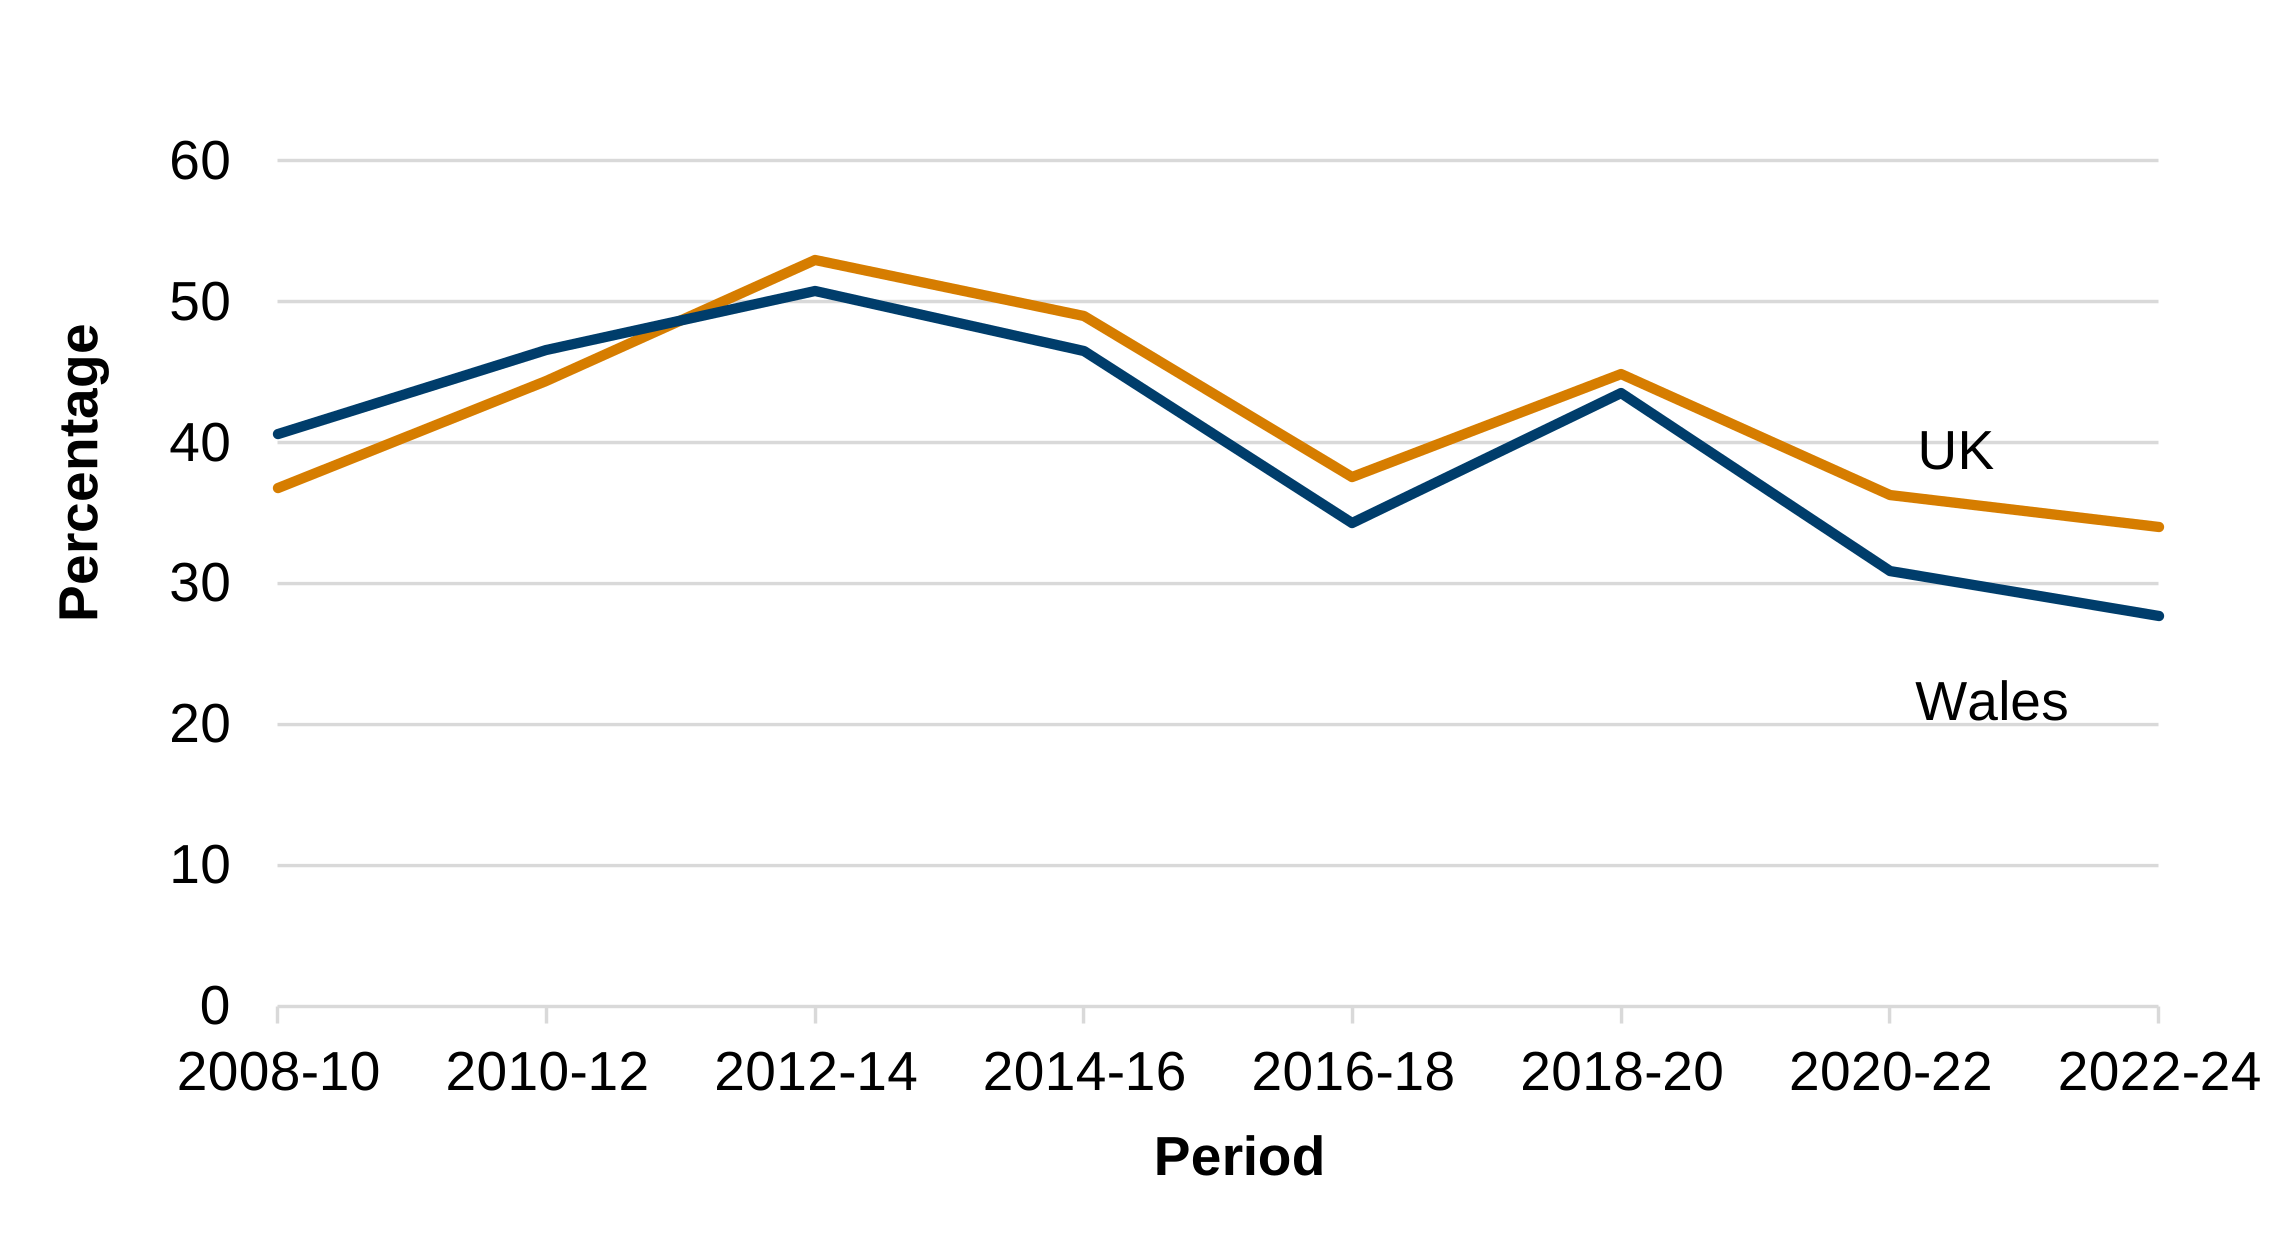
Description of figure 1.2: a line chart showing that the proportion of innovation-active businesses in Wales has closely followed the UK trend, with both showing a decrease for the most recent survey period (2022 to 2024).
Source: UK Innovation Survey, Department for Business and Trade.
Living standards
Household income is a better indicator of people’s prosperity and material wellbeing than economic output measures. Average household incomes in Wales are considerably closer to the UK average than GVA per head. The national income indicator is based on gross disposable household income (GDHI), which measures the income available to households after taxes, social insurance contributions and other expenses have been deducted. The associated national milestone is to improve GDHI per head (income per resident) by 2035. According to the most recent data for 2024, GDHI per head in Wales has increased by 22% nominally since 2020, but declined in real terms after accounting for inflation.
Figure 1.3: gross disposable household income per head, Wales and UK, 2004 to 2024 [Note 1]
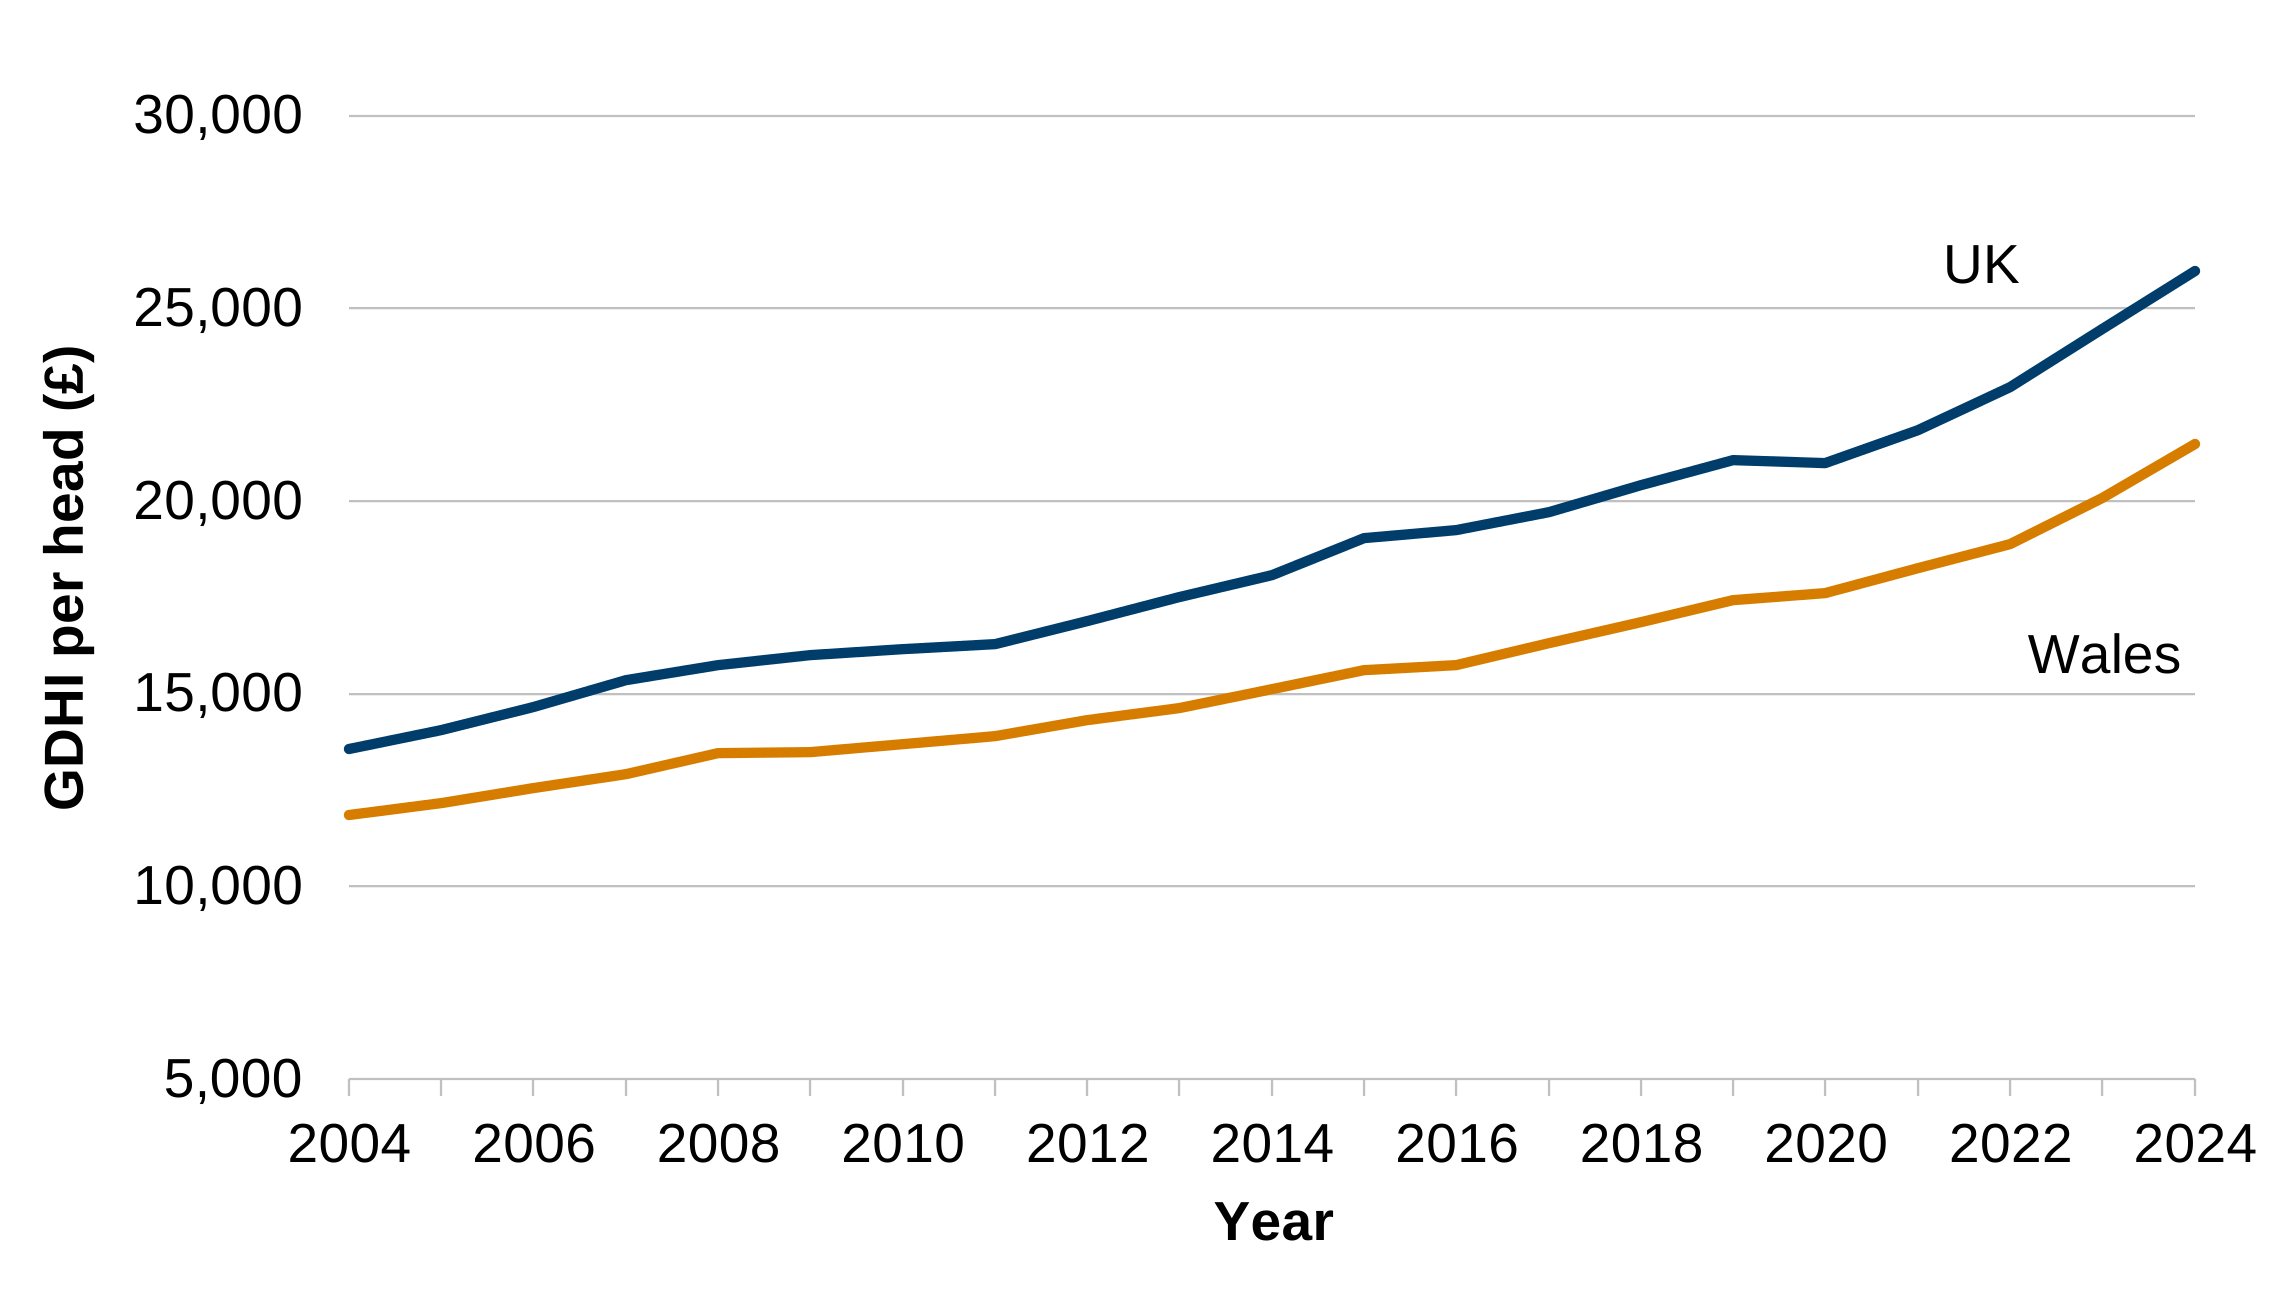
Description of figure 1.3: GDHI per head has increased overall in Wales and the UK since 2004, with the value for Wales remaining below the UK across the timeseries. Further, the gap between Wales and UK has been rising.
Source: Regional Gross Disposable Household Income, ONS
[Note 1] Chart axis does not start at zero.
A comparative analysis with the UK provides a useful basis for assessing relative living standards. GDHI per head in Wales remains at 83% of the UK level, below its peak of 87% in 2004. Wales has the second-lowest GDHI per head among the UK countries and English regions, although it remains broadly comparable with areas of the UK with similar characteristics. In 2024, GDHI per head was 85% of the UK level in North Wales, above the Wales average, and 81% in Mid and Southeast Wales, below the Wales average.
Wales’s relative decline may reflect slower growth in productivity and relatively lower profit margins among self-employed businesses and smaller firms, which are more prevalent in Wales. Wales also continue to have a relatively smaller share of high-income earners than the UK average which will also affect this measure. These issues are discussed further in the Wales Economic and Fiscal report 2025.
Labour market
The national milestone for employment is to eliminate the gap between the employment rate in Wales and that of the UK by 2050. The Annual Population Survey (APS) provides estimates of labour market outcomes at local authority level and for population sub-groups, and is the source used for the national indicators and associated national milestones. As most labour market data are survey-based and subject to volatility, short-term changes should be interpreted with caution.
According to the APS, the employment rate for people aged 16 to 64 in Wales was 72.1% in the year ending March 2026, compared with 75.4% for the UK.. Since the year ending March 2005, the employment rate has increased by 2.7 percentage points in Wales and by 2.9 percentage points in the UK. The employment rate gap between Wales and the UK (shown in Figure 1.4) narrowed in recent years, reaching 1.5 percentage points in the year ending March 2022 and 2.0 percentage points in the year ending March 2025, before widening again to 3.3 percentage points in the year ending 2026.
Figure 1.4: the employment rate gap (people aged 16 to 64) between Wales and UK, year ending March 2005 to March 2026
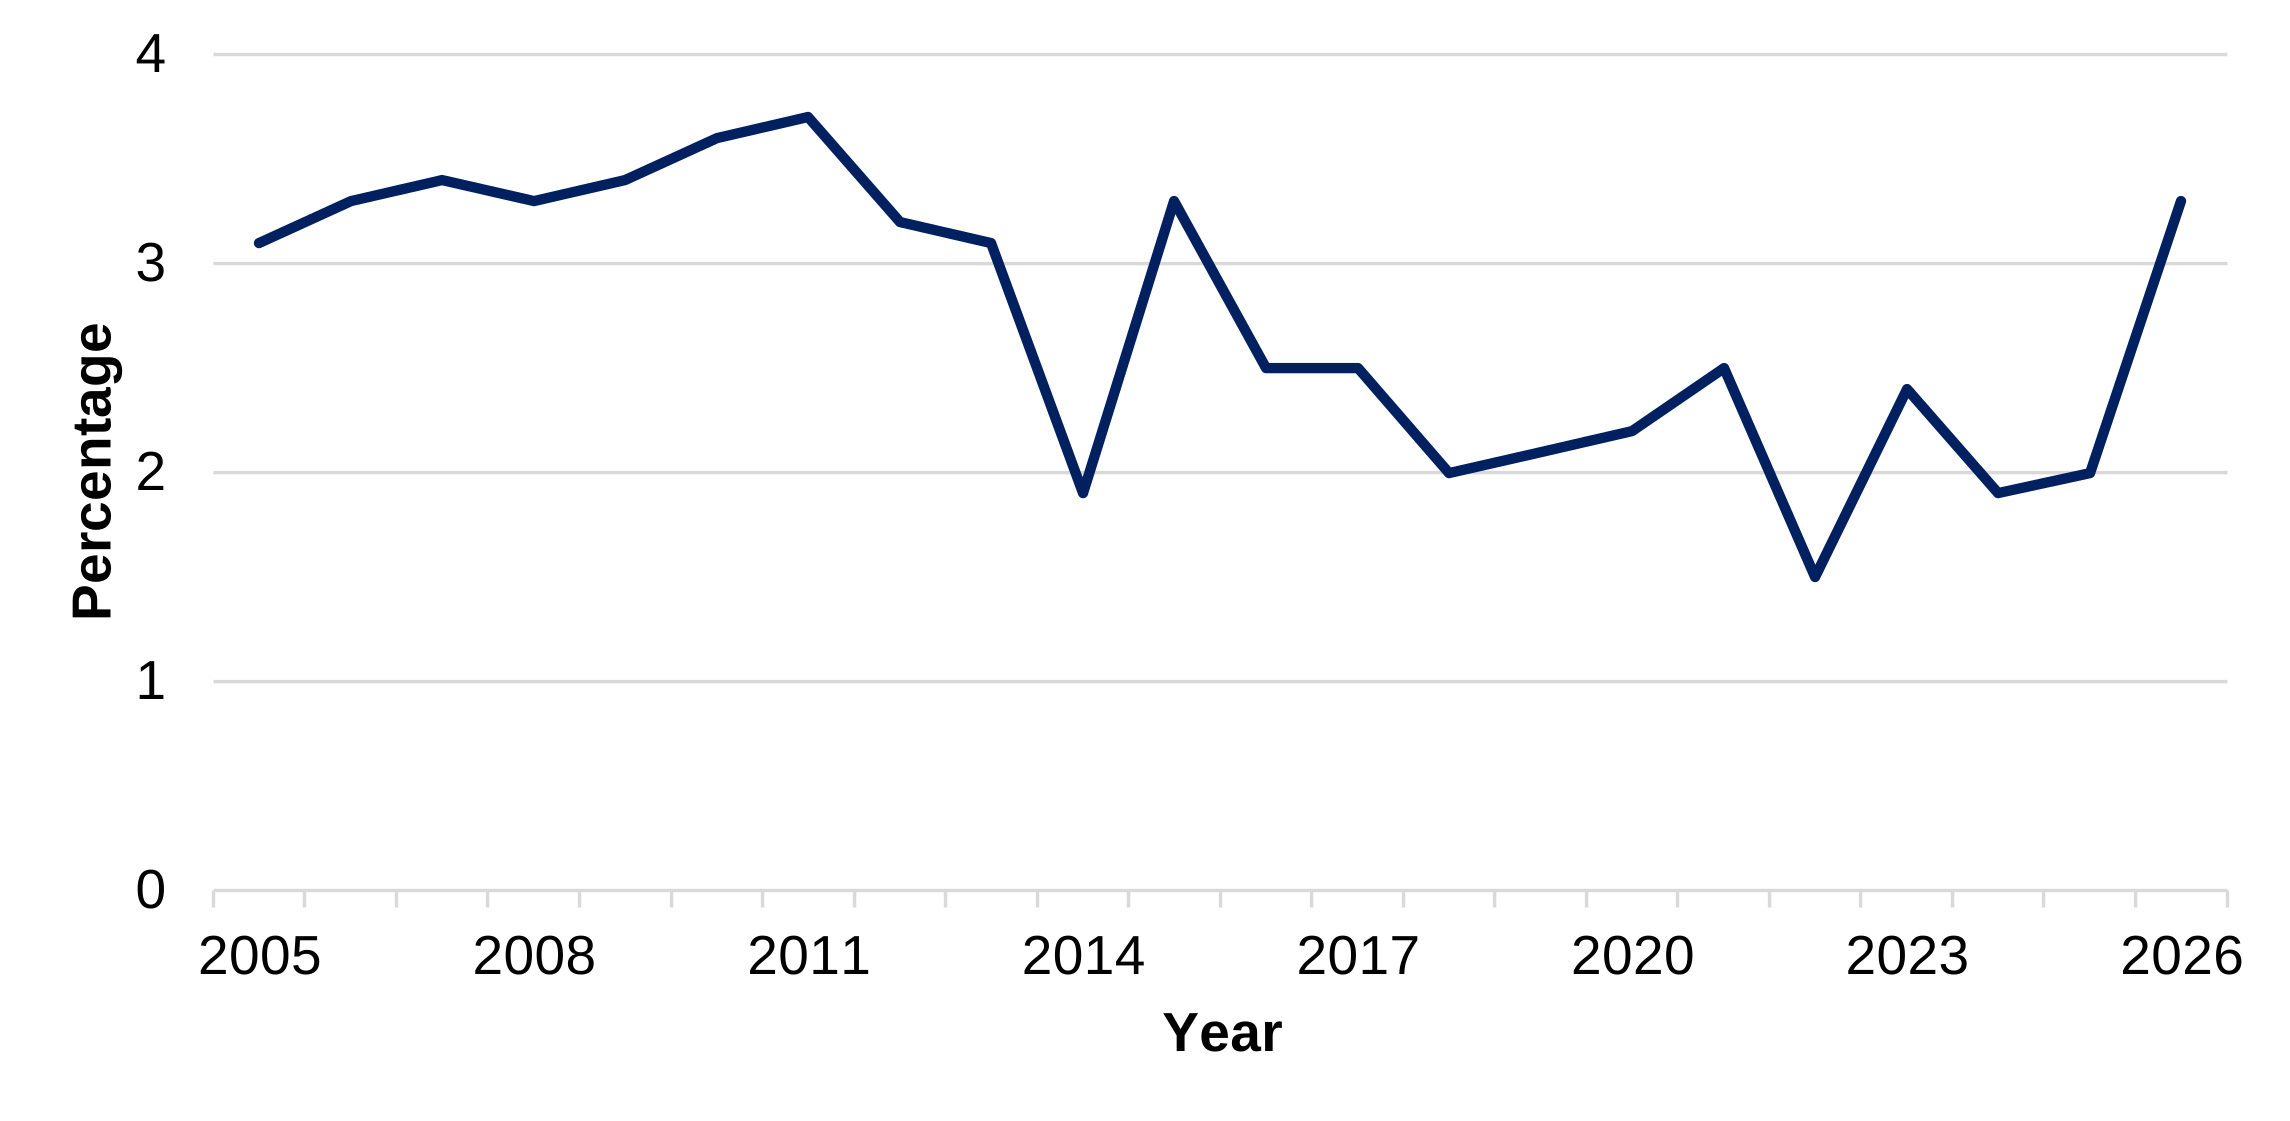
Description of figure 1.4: a line chart showing the employment rate gap between Wales and the UK has fluctuated since the year ending March 2005, with the gap widening in the latest period (year ending March 2026) following a period of narrowing in the preceding years.
Source: Office for National Statistics (ONS)
The Wales Economic and Fiscal report 2025 provides broader contextual information and analysis on labour market performance, with a particular focus on employment, unemployment and economic inactivity at the all-Wales level. These headline indicators are not national milestones.
Participation in education and the labour market
A national milestone on participation in education and the labour market was set in 2021 which is that at least 90% of 16 to 24 year olds will be in education, employment or training by 2050.
Provisional estimates for 2024 show that 86.3% of 16 to 24 year olds were in education, employment or training, down from 86.8% in 2023. The decrease was driven by an increase in economic inactivity for 16 to 18 year olds.
Using the main measure of young people in education, employment or training, there was a decrease in the proportion of 16 to 18 year olds in education, employment or training (from 90.8% in 2023 to 88.3% in 2024) and an increase in the proportion of 19 to 24 year olds (from 84.9% in 2023 to 85.3% 2024).
Using more timely but less statistically robust data from the annual population survey (APS), the proportion of young people aged 16 to 24 in Wales who were in education, employment or training was 83.0% in the year ending December 2025, a decrease of 5.5 percentage points over the year. APS estimates of NEETs in Wales have become increasingly volatile in recent years and are less statistically robust than the statistical release on the issue, which combines the APS with other work-based learning and education sources. The overall trend in the proportion of 16 to 24 year olds in Wales who were in education, employment or training has generally increased since 2010 despite some volatility in the data.
Figure 1.5: percentage of young people in Wales in education, employment or training, 2004 to 2024 [Note 1]
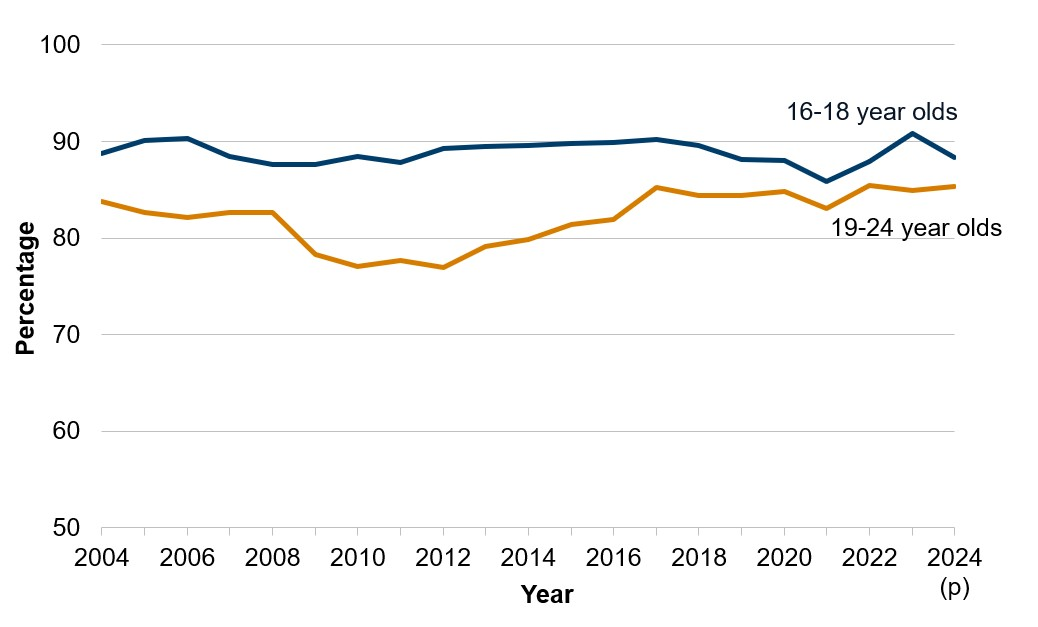
Description of figure 1.5: a line chart showing that the percentage of young people in Wales aged 16 to 18 years old in education, employment or training has remained relatively steady since 2005, whilst the percentage of those aged 19 to 24 years fell below 80% between 2009 and 2014 but has since recovered to 85.3% in 2024.
Source: Participation of young people in education and the labour market, Welsh Government
[Note 1] Chart axis does not start at zero.
(p): Figures for 2024 are provisional.
Fair work and earnings
A national indicator on the proportion of employees whose pay is set by collective bargaining was introduced in December 2021, based on data from the Annual Survey of Hours and Earnings (ASHE). Some 53% of employee jobs were covered by collective bargaining arrangements in 2025, where pay and conditions are negotiated between an employer and a trade union. This has remained steady since 2022 but is lower than in many previous years. However, it is considerably higher than the majority of the other UK countries and England regions and reflects the relatively higher share of employees in Wales who work in the public sector and in manufacturing.
The national indicator on fair work and earnings considers the percentage of people in employment, who are on permanent contracts (or on temporary contracts, and not seeking permanent employment) and who earn at least the real living wage. The real living wage is calculated by the Living Wage Foundation who determine the methodology. It aims to reflect the cost of living.
In 2025, 66% of people on permanent contracts (or on temporary contracts, and not seeking permanent employment) earned at least the real living wage, a decrease from 67% in 2024. This is based on the real living wage for financial year 2025 to 2026 as published in October 2025.
Figure 1.6: percentage of people in employment, who are on permanent contracts (or on temporary contracts, and not seeking permanent employment) and who earn at least the real living wage, 2012 to 2025
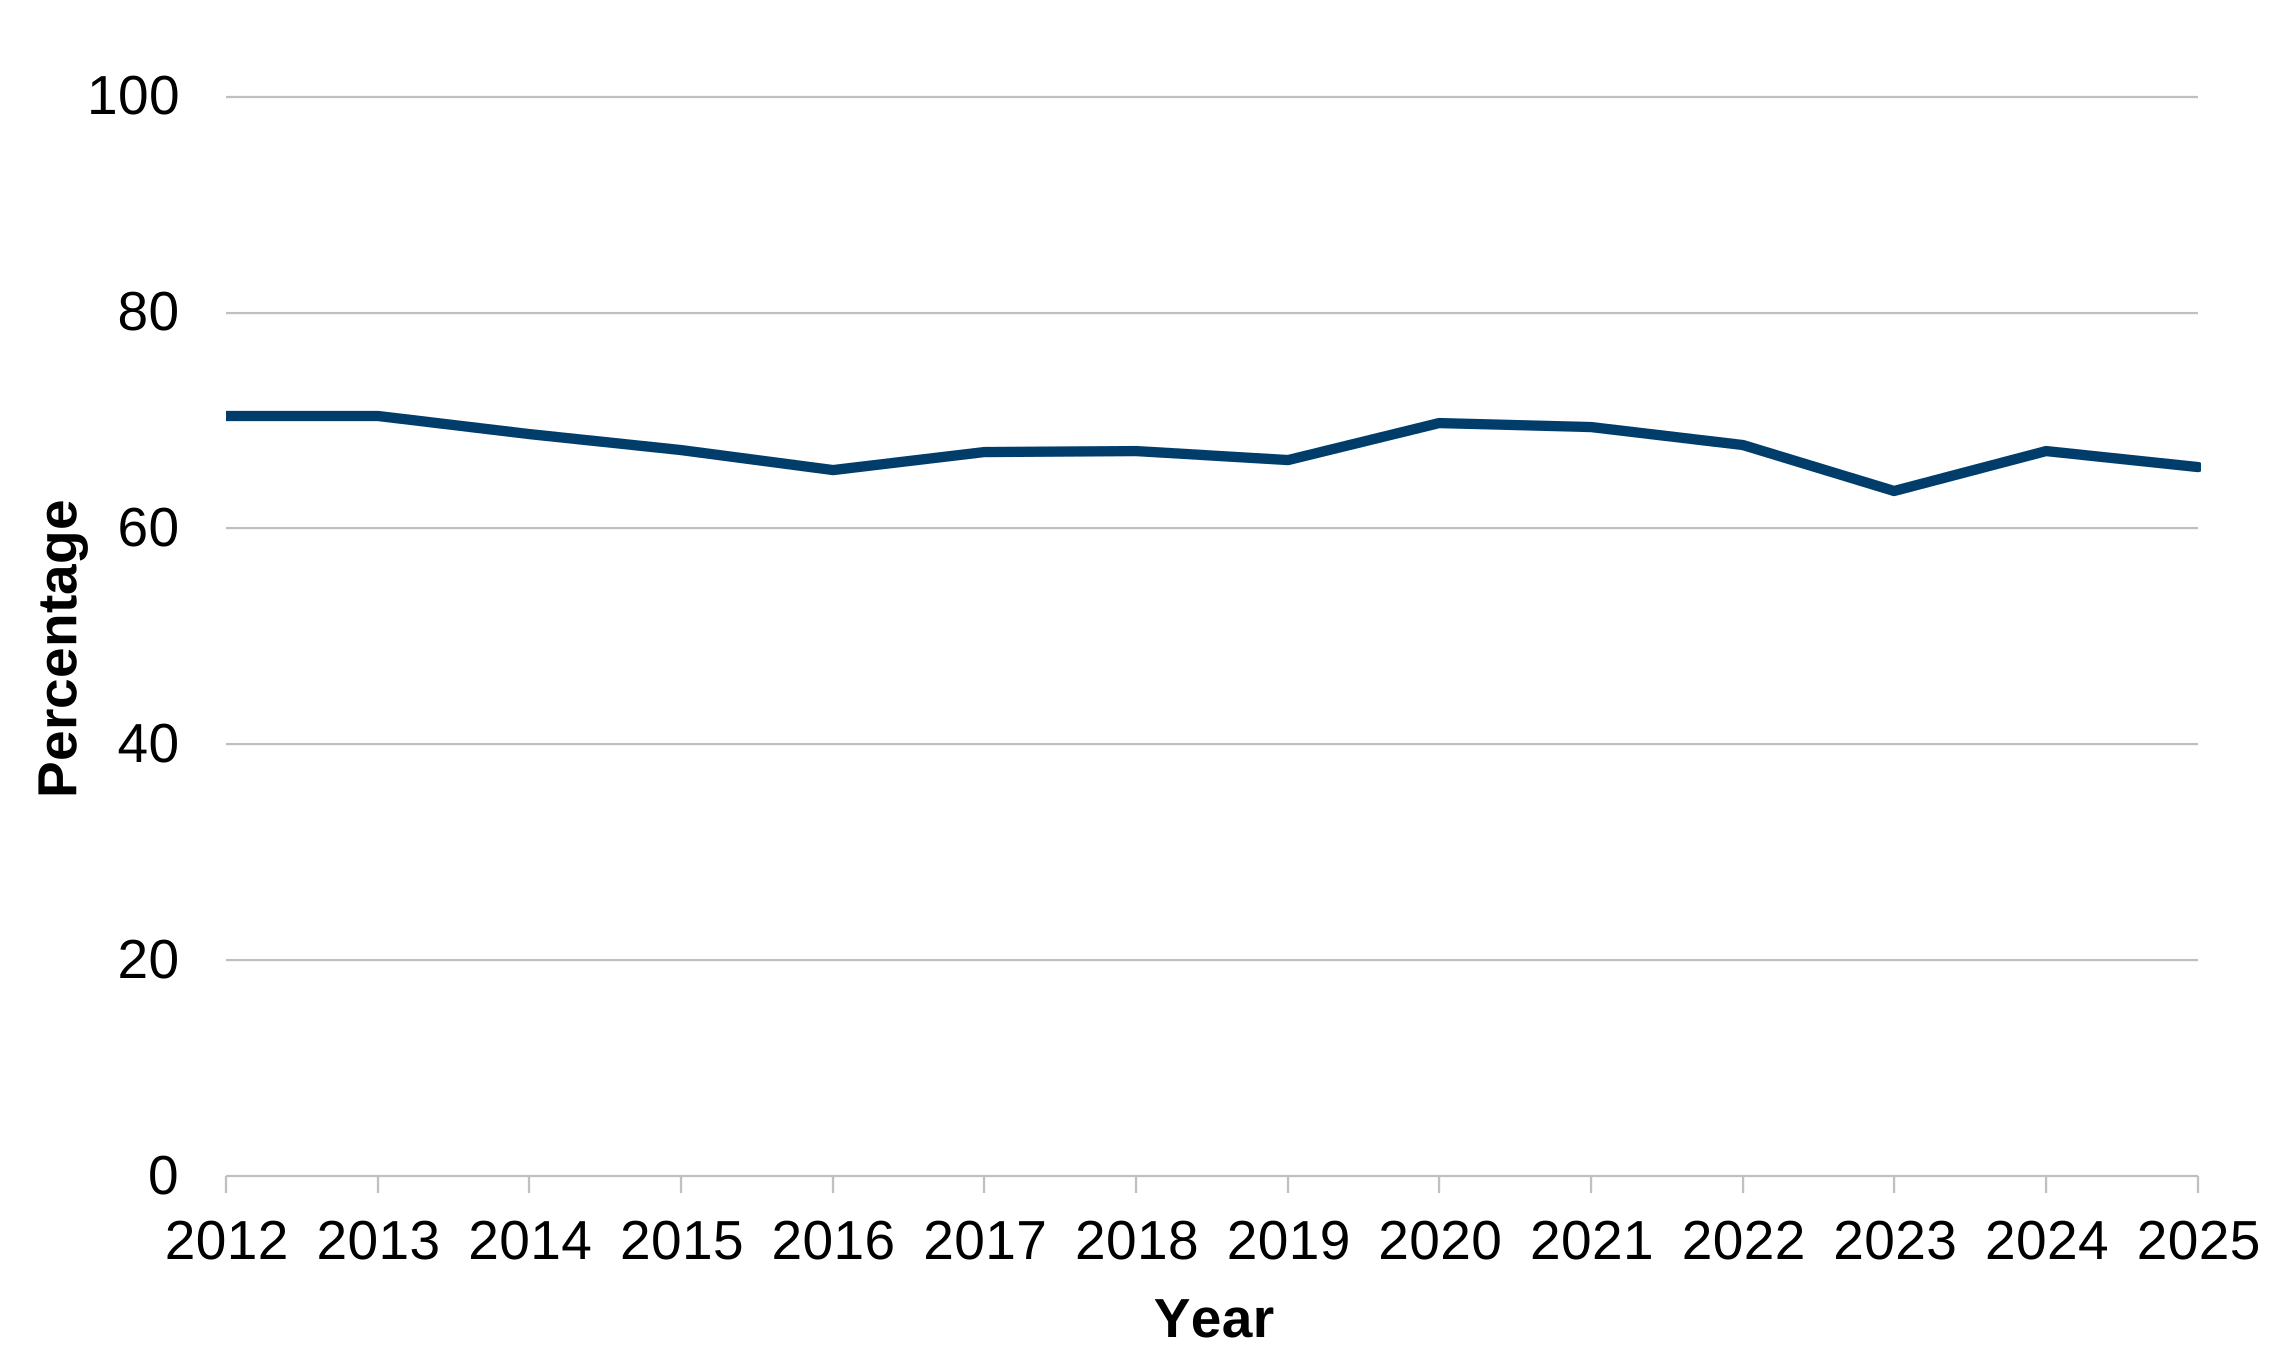
Description of figure 1.6: a line chart showing that the number of people in employment earning at least the real living wage in Wales decreased over the year to 66% in 2025.
Source: Welsh Government analysis of the APS
A national milestone has been set to eliminate the pay gap for gender, disability and ethnicity by 2050. Over the long-term, the gender pay gap (on a median hourly full-time basis and excluding overtime) has narrowed. In April 2025, the (full-time) gender pay gap was 1.9%, up slightly from 1.8% in the previous year. The gap narrowed slightly in the UK to 6.9%.
The gender pay gap for all employees remains considerably higher at 9.7%. This is because women fill more part-time jobs, which in comparison with full-time jobs have lower hourly median pay.
These gaps do not take into account differences in education levels and experience, which vary across genders and affect earning levels.
Figure 1.7: percentage difference in median hourly full-time earnings between men and women, 1999 to 2025 [Note 1]
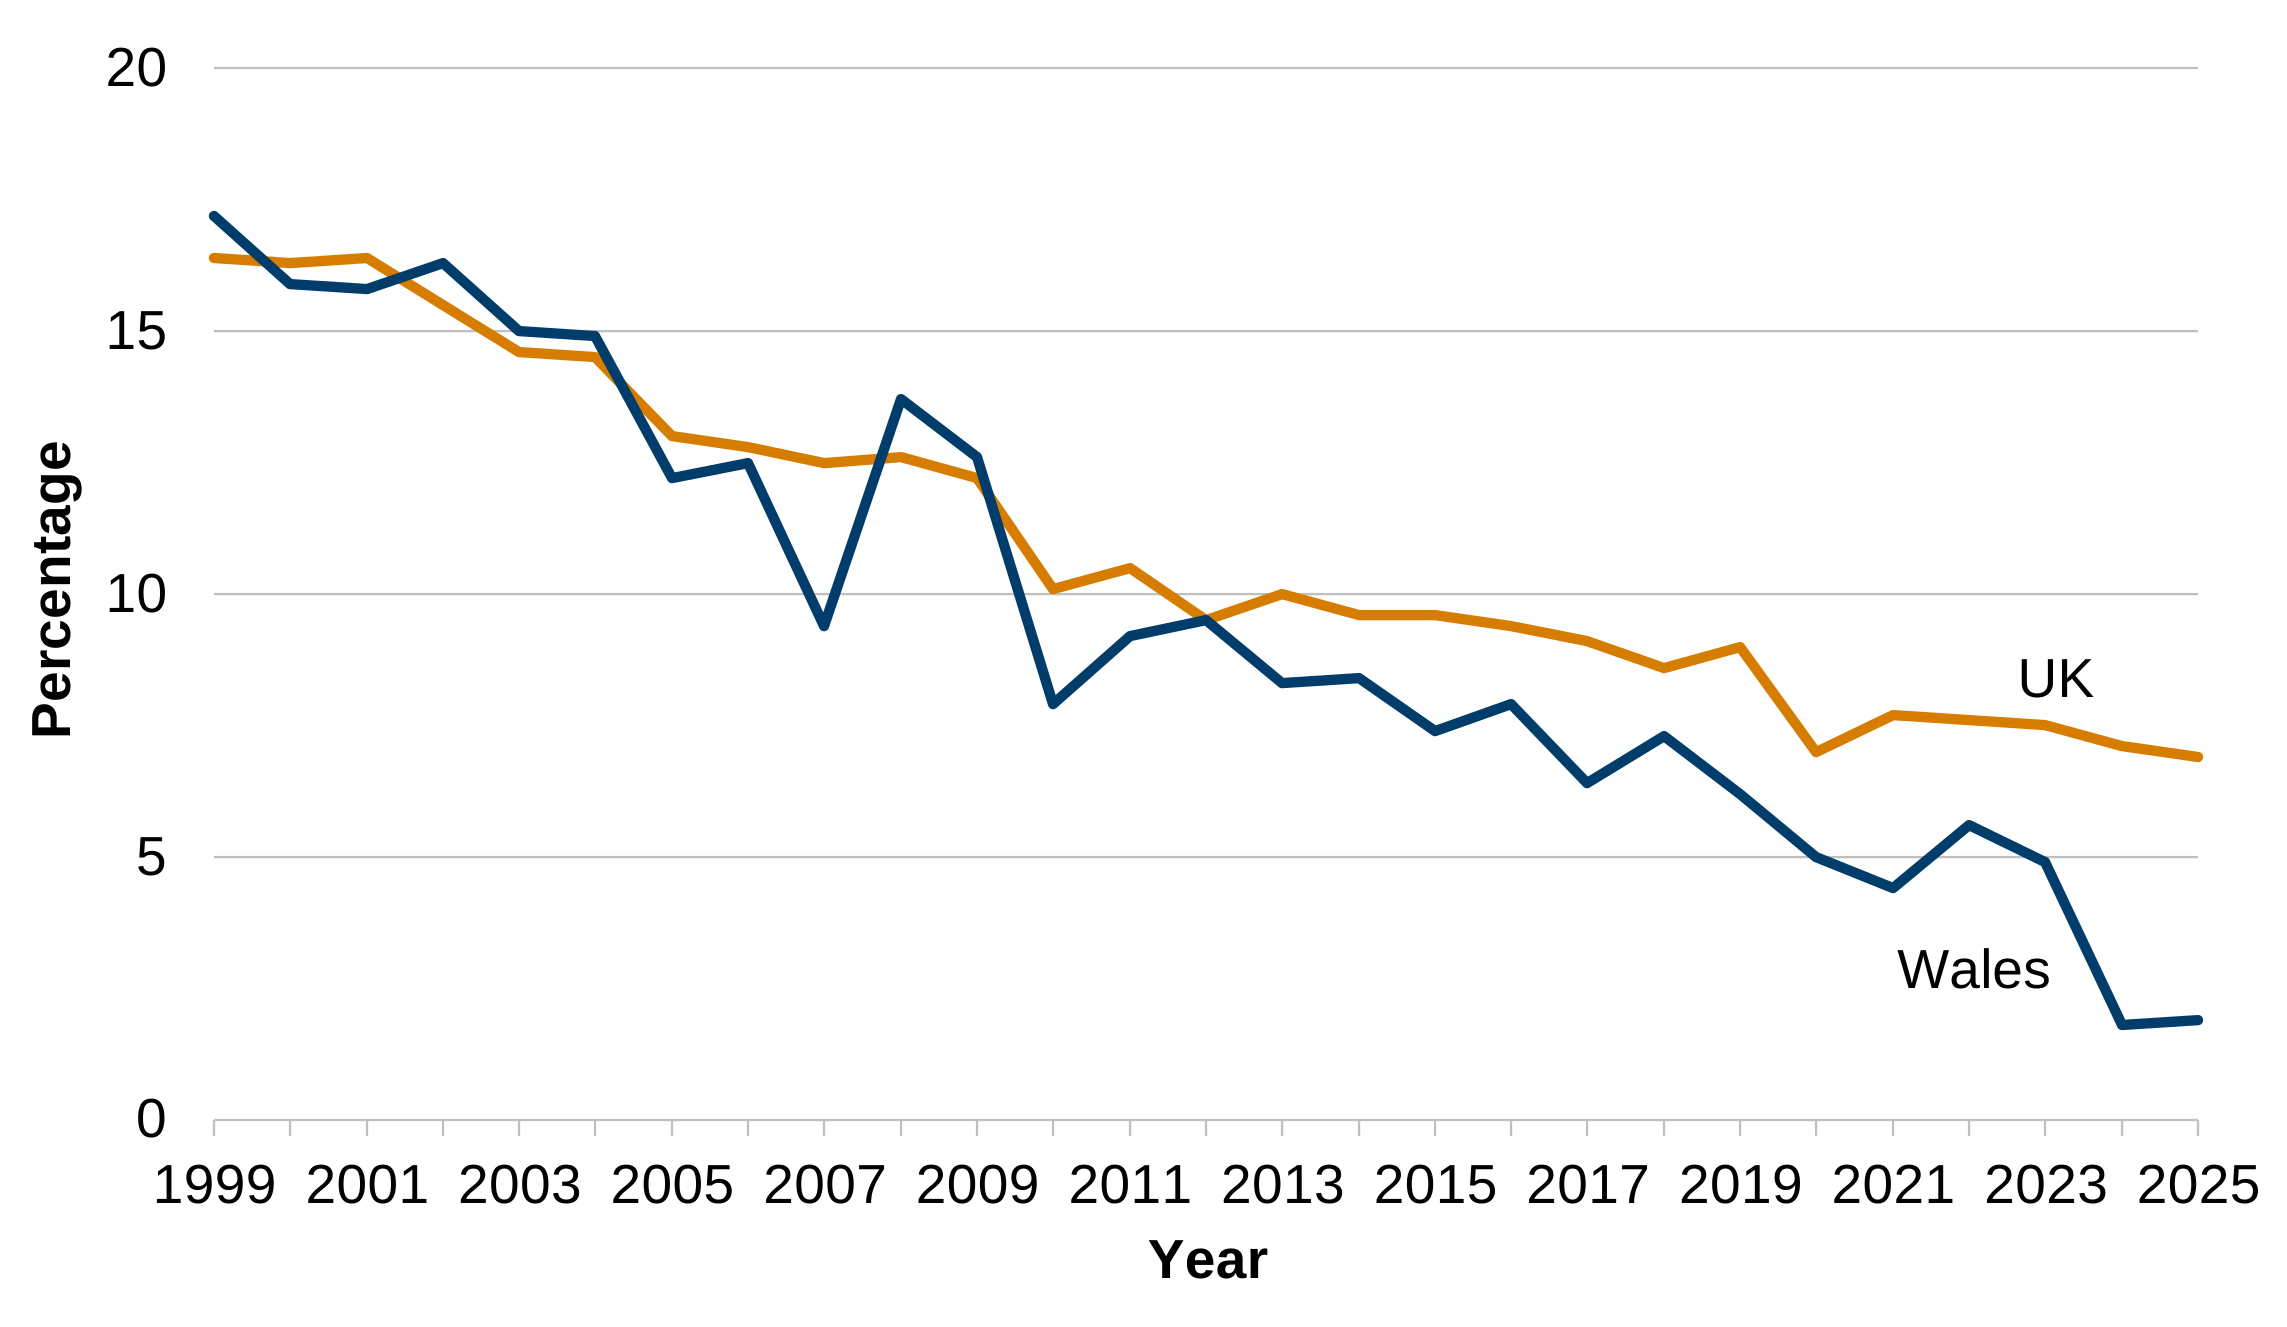
Description of figure 1.7: a line chart showing that the difference in median hourly full-time earnings between men and women has decreased over the last 20 years for both Wales and the UK. Wales has had a narrower gender pay gap than the UK since 2013.
Source: Welsh Government Analysis of the Annual Survey of Hours and Earnings, ONS
[Note 1] A pay difference greater than zero means men’s earnings are higher than women’s.
In 2025, the pay difference between disabled and non-disabled people in Wales was £1.06 an hour (6.6%). This means that disabled employees in Wales earned, on average £1.06 less per hour than non-disabled employees. This is an increase on the previous year when the pay gap was £1.18 (7.8%). However, there is high volatility in the disability pay difference data which means we are unable to determine whether there has been a significant change since 2015.
In 2025, Black, Asian and Minority Ethnic employees in Wales earned, on average £1.32 (8.4%) less per hour than White employees . This compares to an ethnicity pay difference of £0.54 (or 3.6%) in 2024. However, much like the disability pay gap, there is high volatility in the ethnicity pay difference data which means we are unable to determine whether there has been a significant change since 2015.
Disability pay differences are based on median hourly earnings for all employees aged 16 to 64. Ethnicity pay differences are based on median hourly earnings for all employees aged 16 and over.
Due to the high volatility in the data for the ethnicity pay difference in Wales, short-term changes should be considered alongside longer-term trends where possible. Since 2019, the ethnicity pay difference has seen an overall increase where average hourly earnings for White employees have increased by 38.7% whereas average hourly earnings for Black, Asian and Minority Ethnic employees have increased by 28.9%. Differences in pay and employment rates across gender, ethnicity, and disability are also discussed in the A More Equal Wales chapter.
Cost of living
Income spent on housing costs
The national indicator on the percentage of households spending 30% or more of income on housing costs is based on data from the Department for Work and Pensions (DWP) Family Resources Survey.
For the latest period (financial year 2023 to financial year 2025), 14% of households spend 30% or more of their income on housing costs. This percentage varies by housing tenure.
3% of households who own their own home outright and 9% of those who own a home with a mortgage spend 30% or more of their income on housing costs. Percentages are higher for other tenures, with 35% of those in private rented and 33% of those in social rented housing spending 30% or more of their income on housing costs.
The DWP has changed how Family Resources Survey statistics are produced to improve poverty statistics. This change applies from financial year end (FYE) 2022 onwards. The DWP have advised that the changes have resulted in a higher median income for all groups.
These figures are based on results from the Family Resources Survey (FRS) which has a small sample for Wales, and it is unlikely that year-on-year changes are statistically significant. Therefore, we advise caution when looking at changes over time.
Fuel poverty
Household energy costs have been volatile since early 2022 when energy prices rose sharply, reaching a peak by the end of 2022. They have fallen since but remain well above prices from before 2022.
In financial year 2024 to 2025, the average household energy bill (based on standard energy consumption) was estimated to be £1,850, which is 37% higher than in 2021 to 2022. Such price increases have impacted the number of households estimated to be in fuel poverty, as they are likely to be larger increases than changes to income.
A household is regarded as being in fuel poverty if they are unable to keep their home warm at a reasonable cost. In Wales, this is measured as any household that would have to spend more than 10% of their income on maintaining a satisfactory heating regime. Any household having to spend more than 20% is defined as being in severe fuel poverty.
Latest modelled estimates for October 2024 indicate that 340,000 households in Wales (1 in 4 households) were estimated to be in fuel poverty. This is up from around 1 in 7 households in October 2021. 63,000 households in Wales (1 in 20 households) were estimated to be in severe fuel poverty in 2024.
Qualifications
The qualification profile of the Welsh working age population has been improving over time, though there is a break in the series between 2021 and 2022 due to changes to the questions on qualifications in the APS, which now reflect the current qualifications framework.
Skills and qualifications are the biggest single influence on people’s chance of being in employment and on their incomes.
In 2025, 46.7% of working age adults (aged 18 to 64 years) were qualified to at least higher education level (level 4), up from 45.9% in 2024.The proportion of the working age population with at least higher education qualifications has increased considerably in the last 15 years; rising by 12 percentage points in the period from 2009 to 2021, and continuing to rise since.
One of the national milestones on qualifications is that 75% of working age adults in Wales will be qualified to level 3 or higher by 2050. In 2025, 69.7% of working age adults in Wales were qualified to level 3 or higher.
Between 2008 and 2021, there were large falls in the share of working age adults with no qualifications. This proportion stood at 7.2% in 2025. The proportion of working age adults qualified to at least level 2 (equivalent to 5 or more GCSEs at grade A* to C) stood at 88.9% in 2025.
Older adults are more likely to have no qualifications than younger adults.
Within the working age population there was no significant difference in the proportion of men and women who held no qualifications. However, women are more likely to hold qualifications at or above level 4.
Figure 1.8: highest level of qualification held by adults of working age, 2008 to 2025 [Note 1]
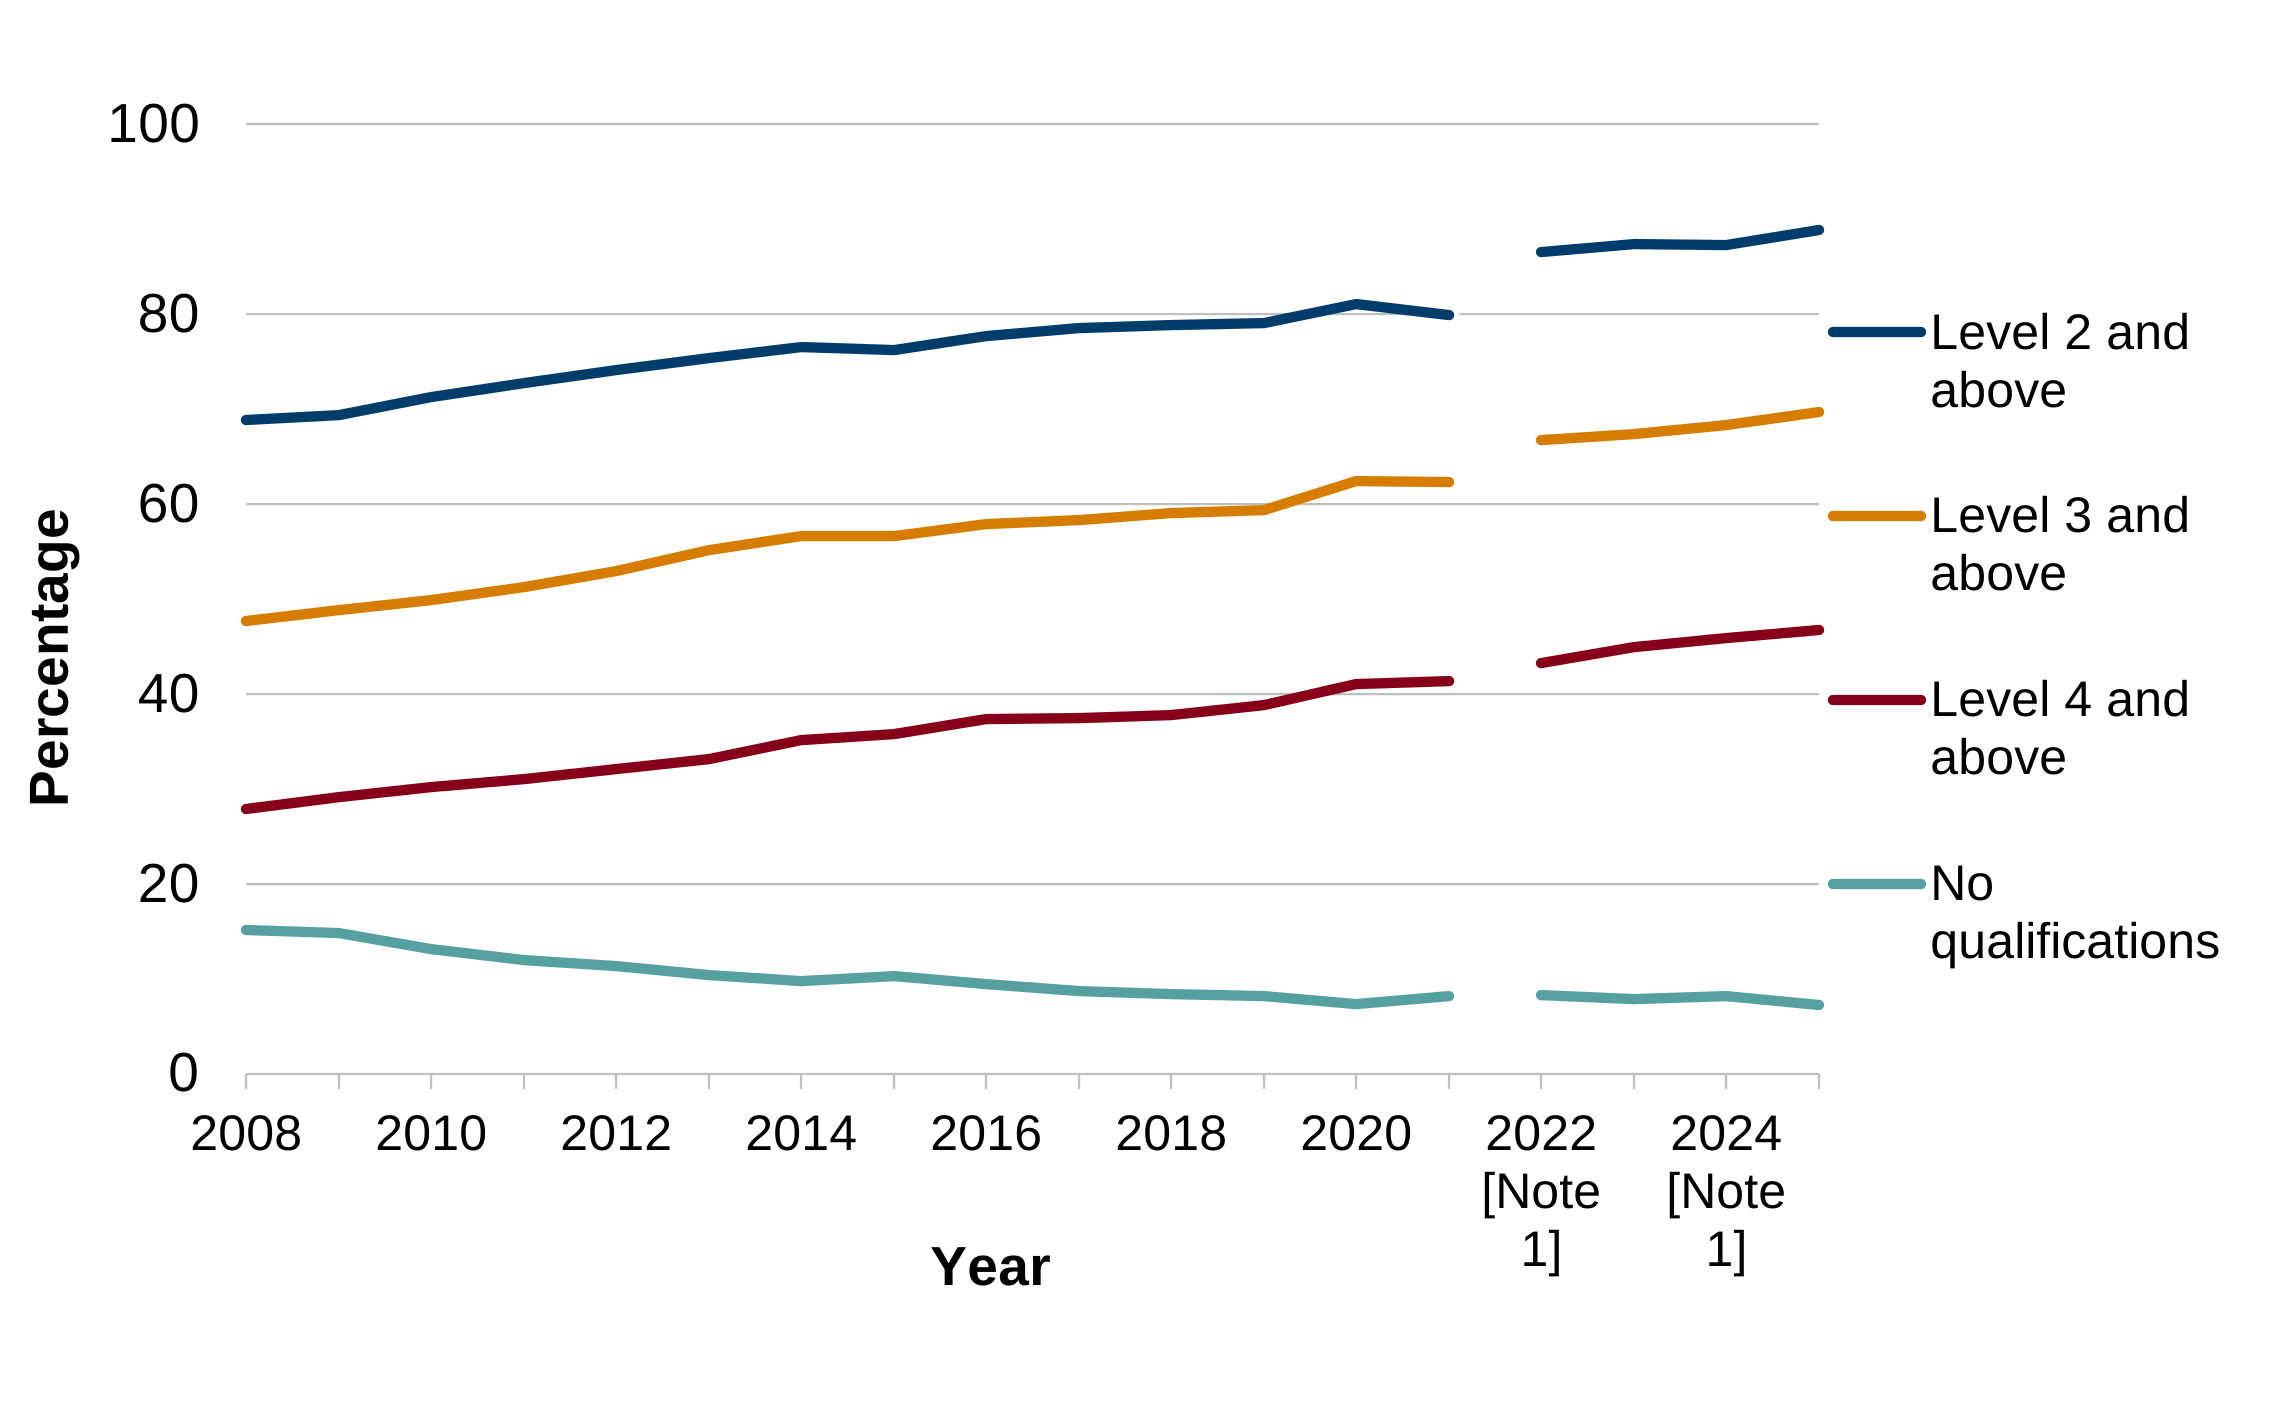
Description of figure 1.8: qualification levels in Wales have steadily increased since 2008, though there is a break in the series between 2021 and 2022 due to comparability issues.
Source: Welsh Government Analysis of APS, ONS
[Note 1] Estimates for 2022 onwards cannot be compared to previous years following changes to the questions on qualifications in the APS.
The other national milestone on qualifications is that the percentage of working age adults with no qualifications will be 5% or below in every local authority in Wales by 2050. In 2025, 8 of Wales’s 22 local authorities have 5% or less of working age adults with no qualifications: Monmouthshire (1.9%), Powys (2.5%), Gwynedd (3.9%), Vale of Glamorgan (4.1%), Carmarthenshire (4.2%), Ceredigion (4.3%), Pembrokeshire (4.4%), Cardiff (4.4%). . The proportion of working age adults with no qualifications was highest in Merthyr Tydfil (14.6%) and Blaenau Gwent (14.5%).
Figure 1.9: proportion of working age population with no qualification by local authority, 2025
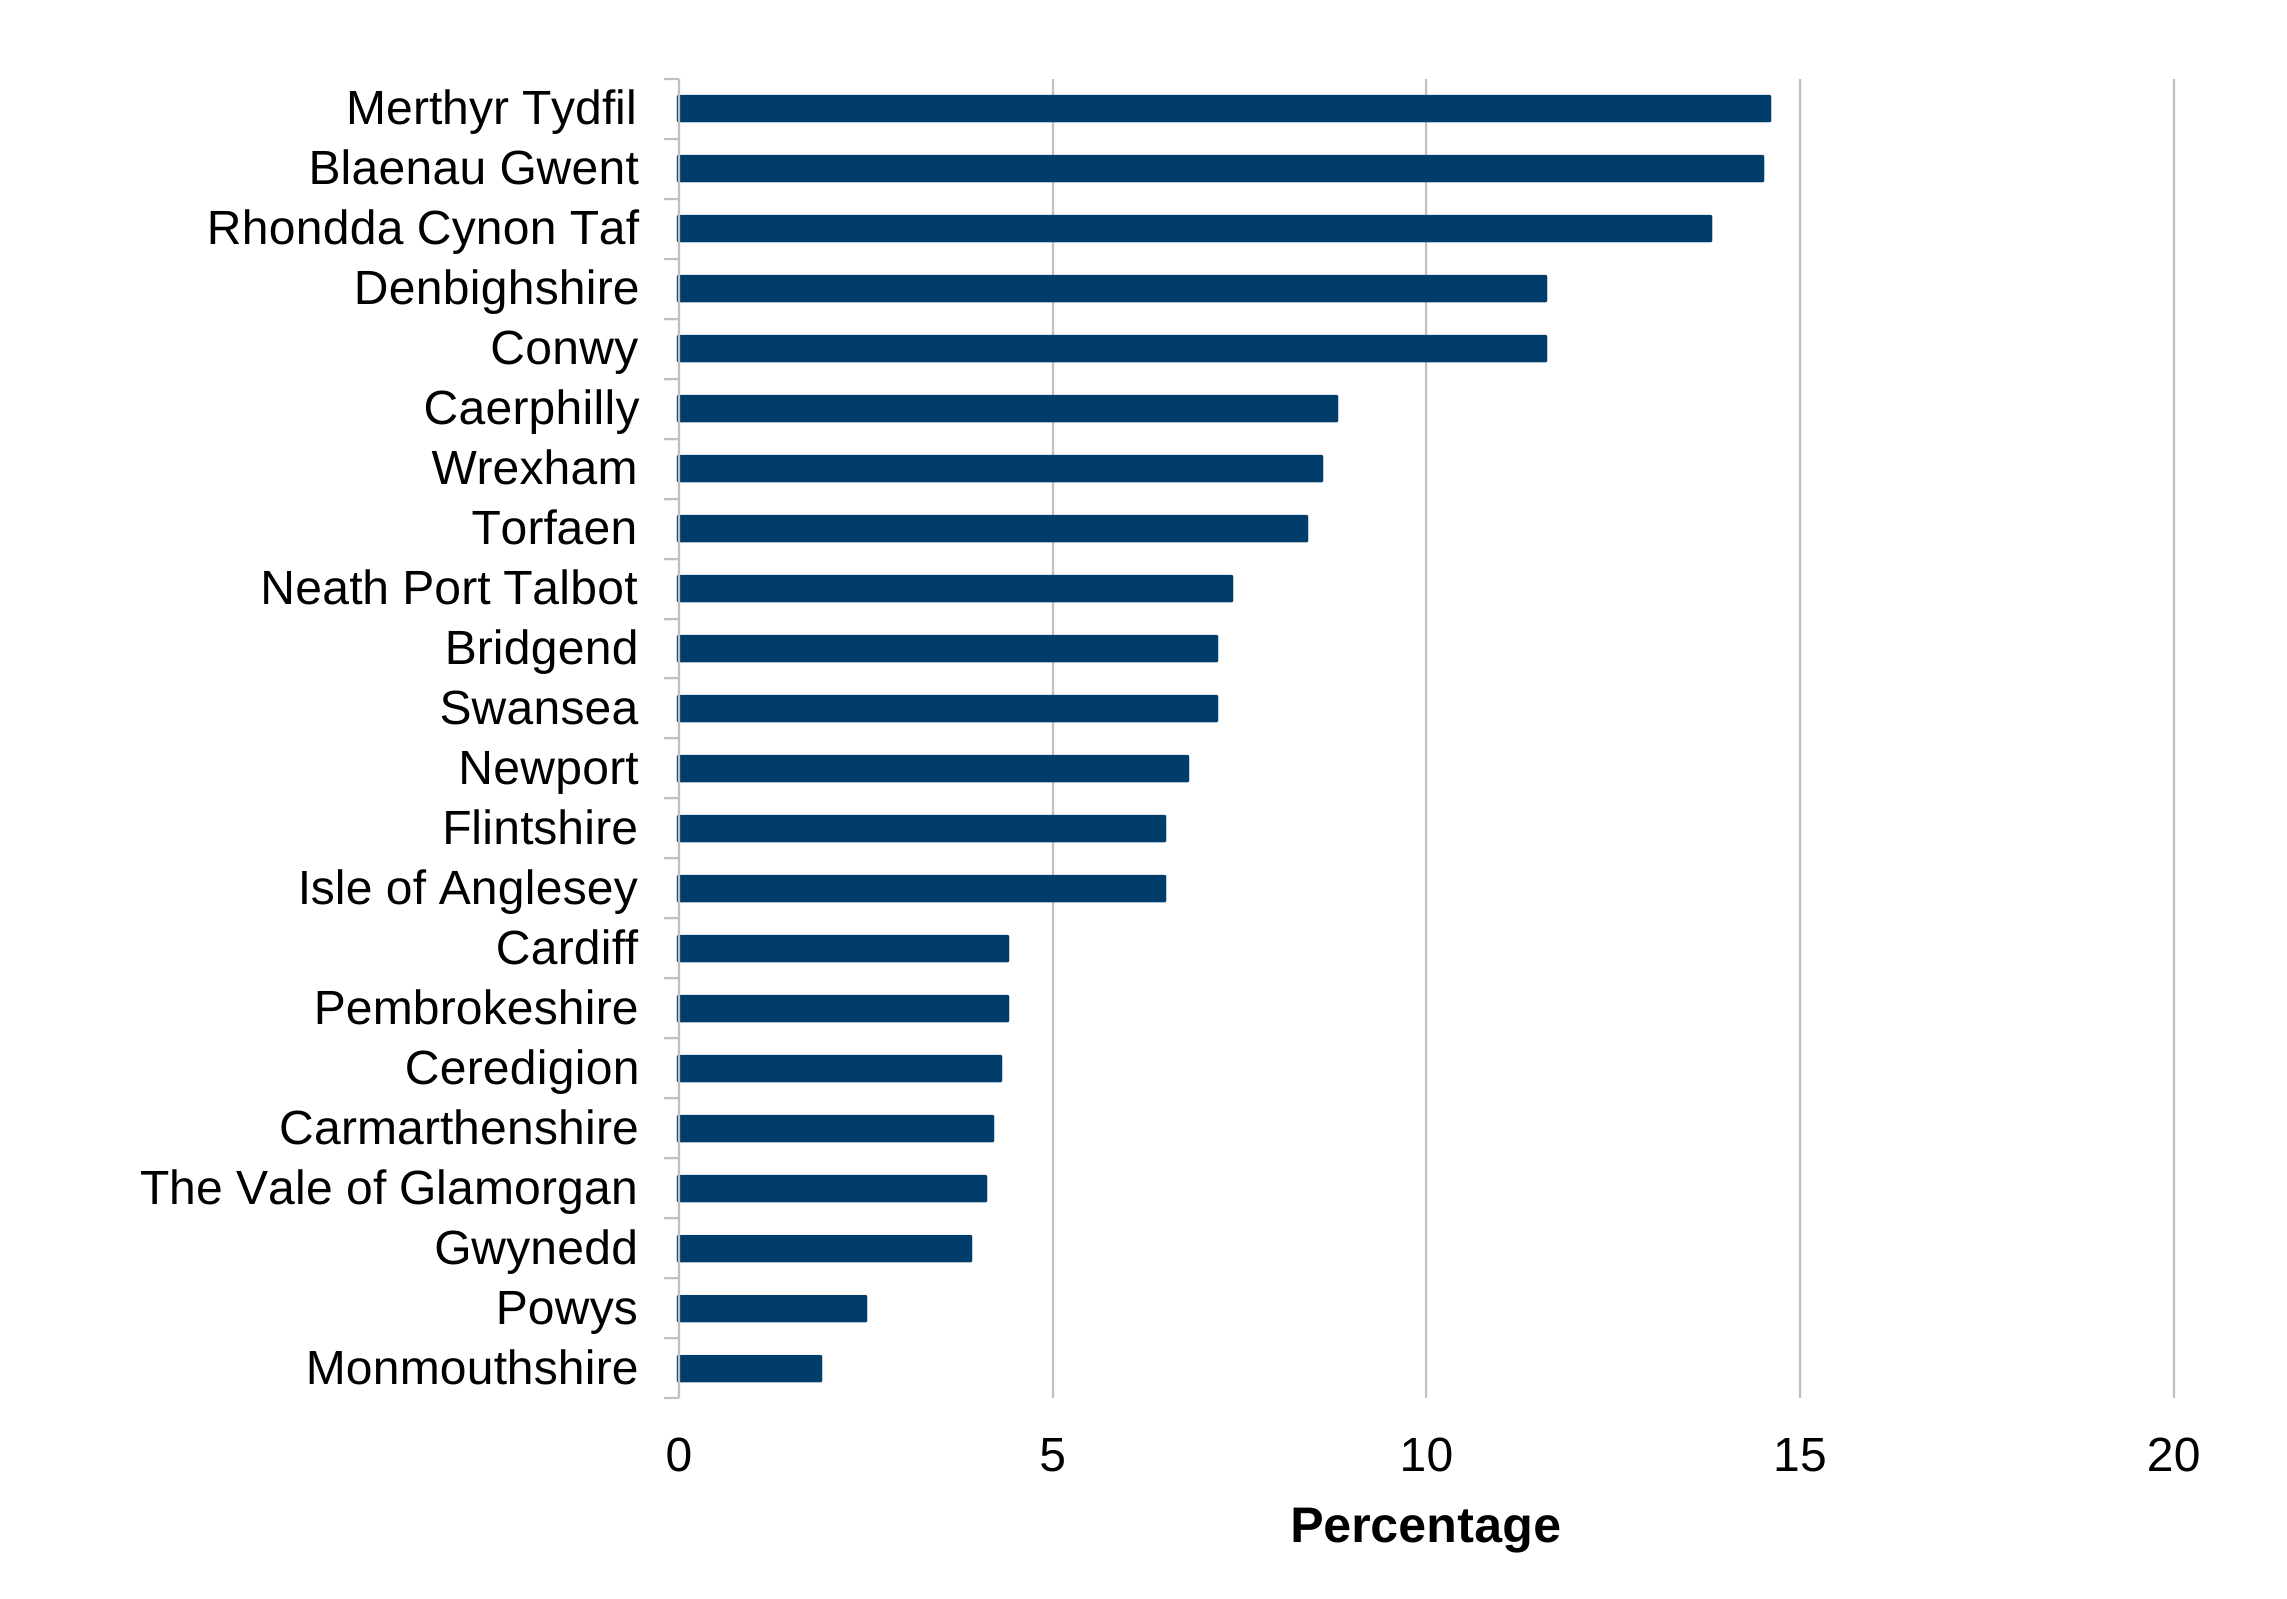
Description of figure 1.9: a bar chart showing the proportion of the working age population with no qualifications in each local authority in 2025. The proportion is less than 5% in the Monmouthshire, Powys, Gwynedd, Vale of Glamorgan, Carmarthenshire, Ceredigion, Pembrokeshire and Cardiff, but is over 14% in Merthyr Tydfil and Blaenau Gwent.
Source: Welsh Government Analysis of APS, ONS
Attainment in schools
Attainment in schools rose in the years prior to the pandemic, however public examinations (such as GCSE and A Levels) were disrupted, particularly in 2020 and 2021 due to the COVID-19 pandemic. In those years all grades that would have been awarded following an examination were replaced with the centre assessed or determined grades. Academic year 2021 to 2022 was a transitionary year in which pupils sat written exams with some adjustments whilst in the 2022 to 2023 school year there was a further transition back to pre-pandemic assessment arrangements (whilst keeping some support in place for learners). The 2023 to 2024 school year saw a full return to pre-pandemic examination arrangements. Further details on these arrangements can be found in our annual Examination results publication.
The ‘capped 9 ‘points score is the national indicator on secondary school performance which focuses on year 11 pupils’ best 9 results at GCSE, including some subject specific requirements.
In 2024 to 2025 the average capped 9 indicator (interim measures version) was 354.3 points, a small increase from 352.1 points in 2023 to 2024. Children from deprived backgrounds still have poorer outcomes.
In 2024 to 2025, pupils eligible for free school meals (FSM) scored 300.8 points and pupils not eligible for FSM scored 379.4 points on average in the capped 9 indicator (interim measures version). This means that pupils not eligible for FSM scored higher than pupils eligible by 78.6 points.
Figure 1.10: capped 9 indicator (interim measure version) by Free School Meal (FSM) eligibility, academic years 2018 2025 [Note 1]
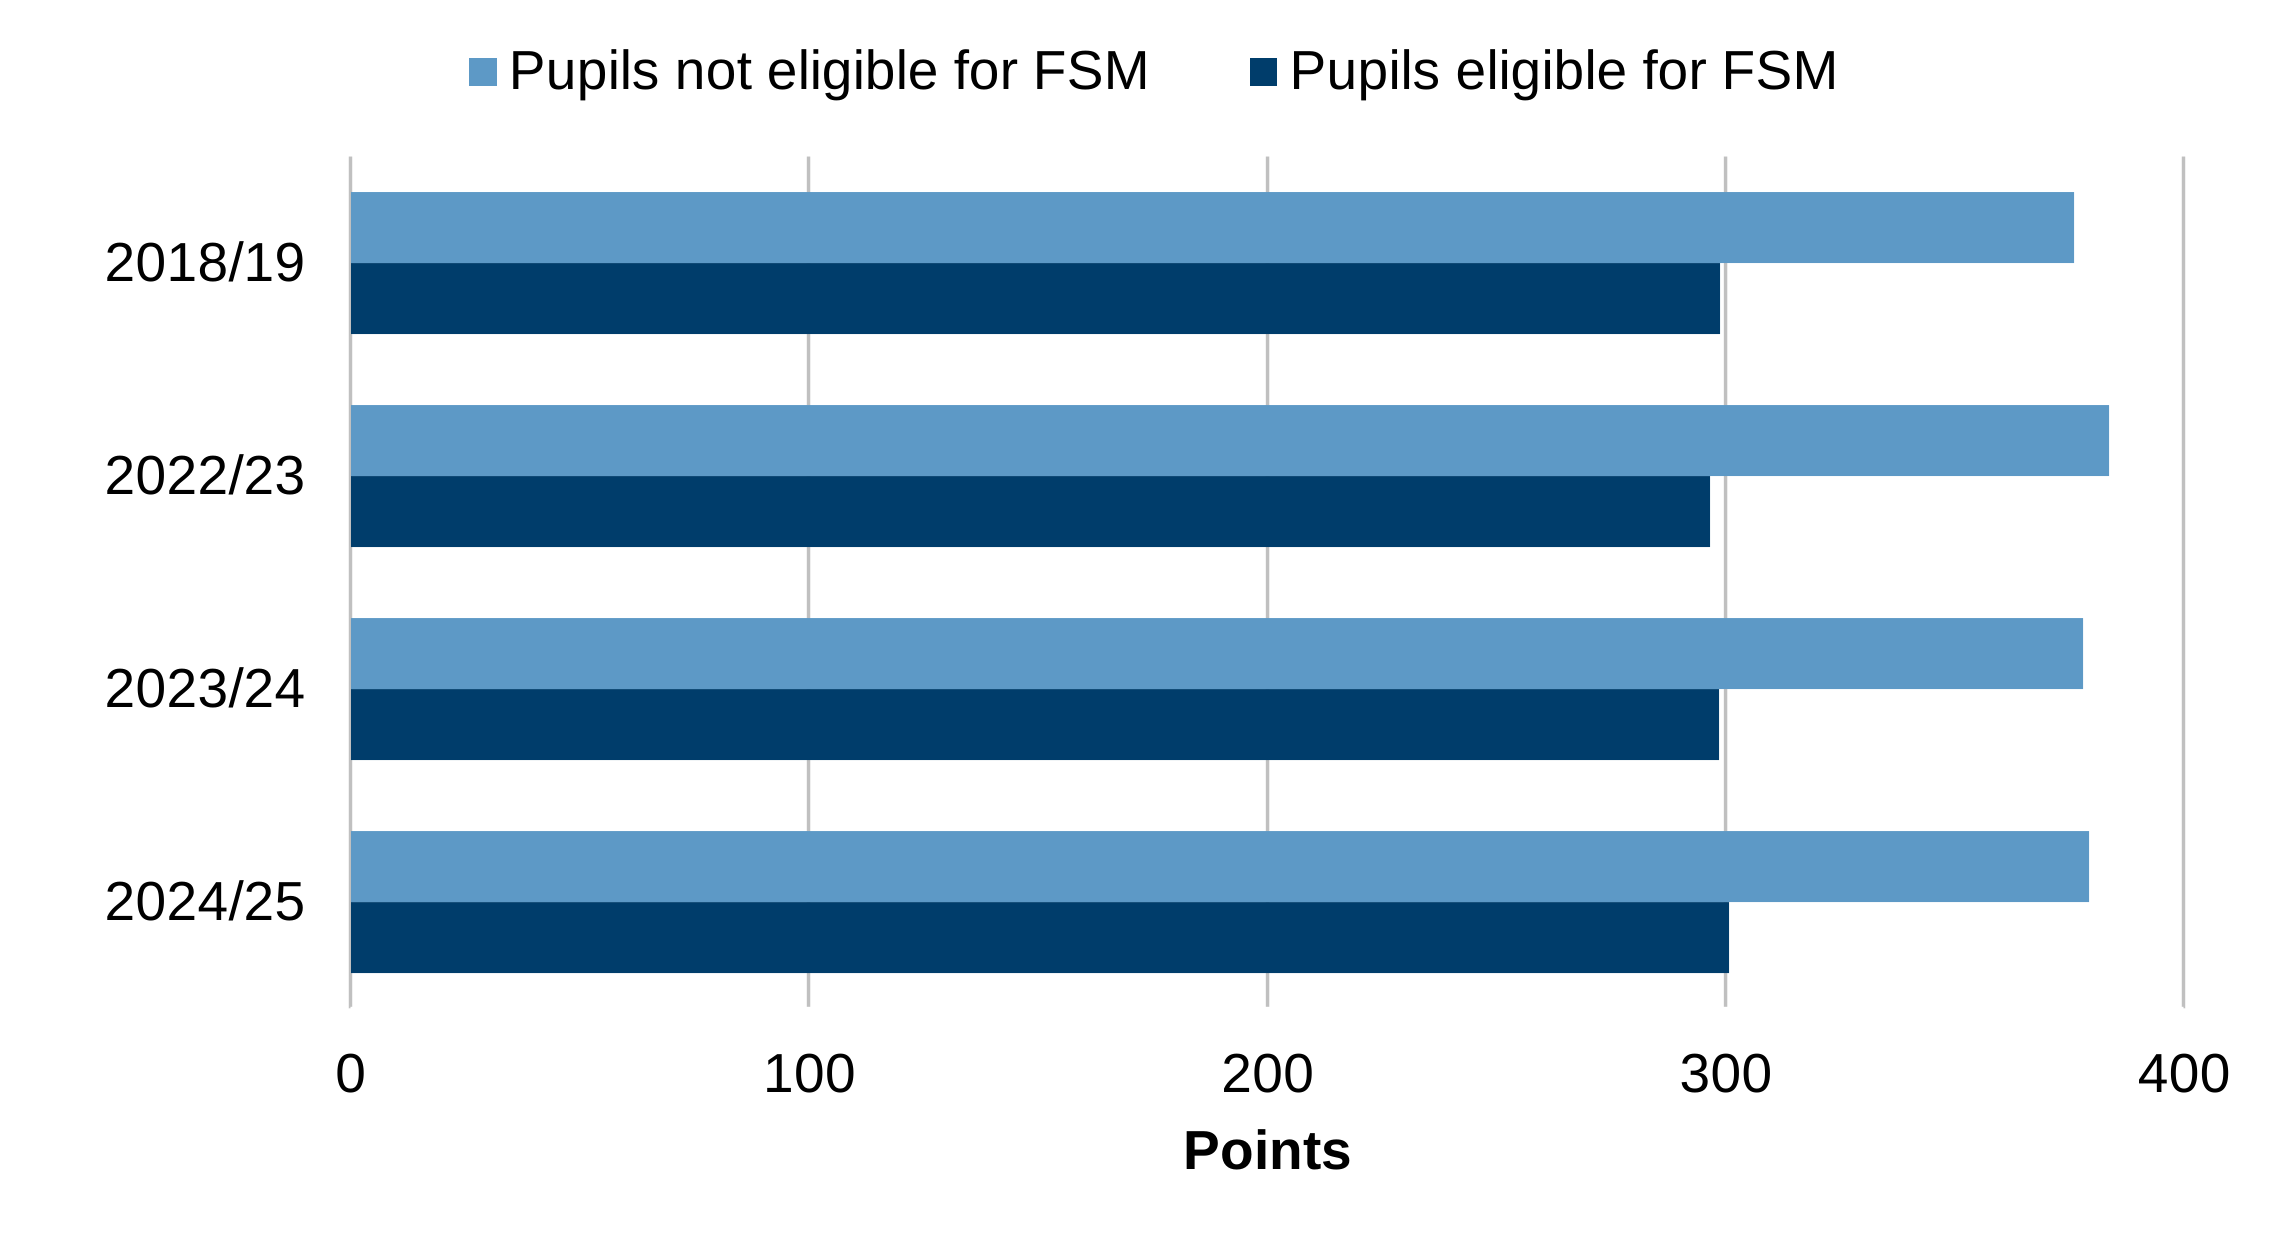
Description of figure 1.10: a bar chart showing the average Capped 9 indicator for students eligible for free school meals and students not eligible for free school meals in academic years 2018 to 2019, 2022 to 2023, 2023 to 2024 and 2024 to 2025. Pupils not eligible for free school meals scored higher in each of the years shown.
Source: Examination Results, Welsh Government
[Note 1] The capped 9 indicator was not reported between 2019 to 2020 and 2021 to 2022 due to the disruption caused by the COVID-19 pandemic.
Further reading
Previous versions of the Wellbeing of Wales report included further analysis of the following.
Assessments of stage of development of 4 year old pupils in mathematics, language, literacy and communication related to the Foundation Phase Framework. This information is no longer captured due to the roll-out of the new Curriculum for Wales from September 2022.
Labour market overview, provides a monthly update on the Welsh labour market.
The Welsh economy in numbers dashboard shows trends in the main economic outcomes for Wales, compared to the UK.
The Wales Economic and Fiscal Report reviews recent economic developments and the economic and fiscal prospects facing Wales.
There are several studies covering productivity and real incomes, for example, see Resolution Foundation’s Stagnation nation: the Inquiry and The UK Productivity puzzle in an international comparative perspective (Wiley Online Library).
Further information on regional income can be accessed from the Institute for Fiscal Studies Living standards, poverty and inequality in the UK.
Data is also available from the Census of Population on highest qualification levels. Census in Education in Wales (Census 2021) provides a summary of the data for Wales. The statistics available from the Census are not directly comparable to those presented in this Wellbeing of Wales report. As well as the different data collection modes, these statistics are based on working age adults (aged 18 to 64) whereas those from the Census are based on all usual residents aged 16 and over.
Information on the awarding of grades for school and college qualifications (GCSE, A Level, AS, Skills Challenge Certificate and Welsh Baccalaureate) in the years impacted by COVID-19 is available in the statements below.