Wales Visitor Economy Profile: 2021
Summary of employment, earnings, enterprises, expenditure and output data relating to the tourism and hospitality industries in Wales for 2021.
In this page
Research aims and methodology
This report summarises latest available data on Tourism enterprises, Tourism employment and earnings, as well as Tourism expenditure and Gross Value Added (GVA) in Wales. Tourism expenditure and GVA is reported for 2019, whilst data for tourism employment relate to 2020, and tourism enterprises and earnings data relate to 2021. Full data tables covering from 2015 to the latest available period are included in the Annex. Please note that 2021 Earnings data and 2019 GVA data are provisional.
The report is based on a revised definition of the tourism and hospitality industries in Wales developed by Visit Wales using the UK Standard Industrial Classification to identify classes of business activity that are more dependent on tourism spending.
Definition of tourism industries
The UK Standard Industrial Classification (SIC) is used in classifying business establishments by the type of economic activity in which they are engaged. It can be used as a convenient way of classifying industrial activities into a common structure.
For the purposes of this report, Visit Wales has identified a set of UK SIC divisions, classes and subclasses that may represent the tourism industries in Wales. Further information on the UK SIC hierarchy and the specific divisions, classes and subclasses used here, based on a broad definition of tourism characteristic industries, are set out in the tables in the Annex.
Furthermore, for the purposes of this report, Visit Wales has also identified seven sub-sectors of Tourism Industries in Wales.
- Accommodation for visitors
- Food and beverage service activities
- Sporting and recreational activities
- Cultural activities
- Passenger transport
- Travel agencies and other reservation activities
- Country specific tourism activities
The corresponding UK SIC classes and sub classes are shown in Table 5.1.
Hospitality is defined as a sub-section of the tourism industries, based on specific subclasses shown in Table 5.0. Therefore for the purposes of this publication, the figures reported for the tourism industries include hospitality as well as the non-hospitality parts of tourism.
Data for employment and registered enterprises in this report is provided for all Tourism Industries, for Hospitality, and for the seven tourism industry sub-sectors.
Whilst figures for employment and enterprises in this report are based on the preferred and more precise definition for tourism industries, estimates for Gross Value Added (GVA) and earnings are based on different approximations since neither GVA nor earnings data is available at SIC class or subclass level.
Instead, GVA is reported for seven SIC divisions, four of which fall into the Visit Wales tourism industry definition in their entirety. The remaining divisions are included in this report as they are predominantly related to Tourism, though they include activity which is not counted in the Visit Wales tourism industries definition.
Whilst earnings data are published at SIC division level, figures reported here are based on SIC sections, the level above, for increased accuracy where possible. As illustrated in Table 5.3, two SIC sections reported on map directly onto six of the seven SIC divisions identified for analysis of GVA data, and the remaining SIC division is reported at division level. See Table 5.9 for details.
This difference in industry coverage should be borne in mind when comparing GVA or earnings figures alongside those for employment and enterprises. See Table 5.2 for details.
Domestic tourism expenditure is reported using data from the Great Britain Tourism Survey and Great Britain Day Visit Survey, official statistics relating to tourism. Tourism trip definitions are based on standardised characteristics and further information can be found in recent annual reports. Inbound tourism expenditure is reported here based on data from the International Passenger Survey (IPS), conducted by the Office for National Statistics and further methodological information can be found in this article.
The revised definition of tourism industries used in this publication has been updated from the definition previously reported in the Welsh Government Priority Sector Statistics. The revised definition includes some additional industries and excludes others, to better reflect the set of industries reliant on tourism. This publication uses different data sources from the Priority Sector Statistics figures. Historical data using the revised tourism industries definition and updated data sources is provided in the Annex to allow for time series analysis.
Small discrepancies between category breakdowns and totals may be present, due to rounding. Data sources are listed in Table 5.17.
Main findings
Employment and employee jobs in 2020
This section uses information from the Business Register and Employment Survey (BRES) used by the Office for National Statistics to produce official employment statistics. BRES data includes employees of businesses, and self-employed workers if registered for VAT or Pay-As-You-Earn (PAYE) schemes. Self-employed people not registered for these, along with HM Forces and Government Supported trainees are excluded.
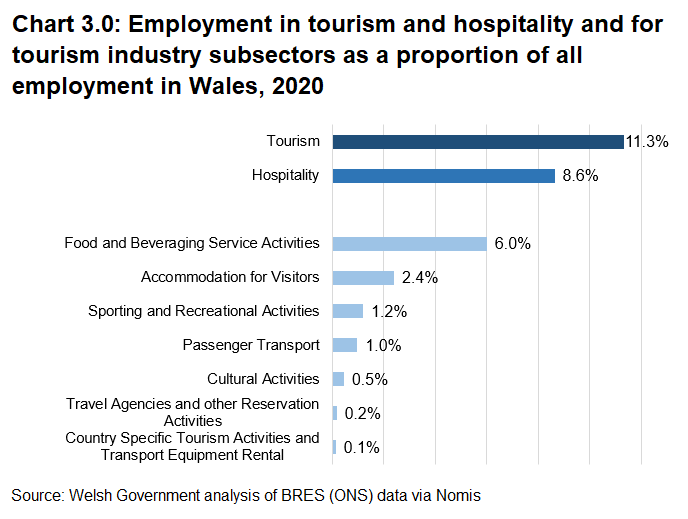
Tourism Industries accounted for 11.3% of employment[footnote 1] (151,000) in Wales in 2020, a fall from 161,000 in 2019 (12.1% of employment in Wales) during which time overall employment levels in Wales remained unchanged. Tourism as a proportion of all employment in Wales over recent years has fluctuated, falling to 10.5% in 2017, before rising to a recent peak in 2019.
76% of tourism employment (115,000) was in hospitality. The decline in Tourism employment in 2020 was driven largely by a fall within hospitality industries, from an employment level of 128,000 in 2019 (9.6% of employment in Wales) to 115,000 (8.6%) in 2020.
The sub-sector accounting for the largest proportion of employment in 2020 was Food and Beveraging Service Activities with 6.0% (80,000) of employment in Wales followed by Accommodation for Visitors with 2.4% (32,000).
55% of employee[footnote 2] jobs in tourism in 2020 were part time, compared with just 34% of employee jobs in all industries. Within hospitality, 61% of employee jobs were part time. The proportions of part-time and full-time employees within Tourism and Hospitality, and in Wales overall, have remained steady over recent years, though in 2020 the proportion of part time Tourism employees dropped slightly from 57%. Whilst tourism accounted for 11.3% of employment in Wales in 2020, it accounted for almost 1 in 5 (18.4%) of part time employees (78,000 employees). The number of part time tourism employees fell by approximately 10,000 between 2019 and 2020, compared to full time tourism employee levels which fell by around 2,000.
In Mid Wales 13.2% of employment was in a Tourism industry in 2020, the largest proportion of the four regions, compared to only 10.0% in South East Wales. A similar pattern can be seen over the past few years, with North and Mid Wales having the largest proportion of employment in tourism industries, and South East Wales the lowest. There is considerable variation within region and across the nation. In Pembrokeshire and Anglesey over 20% of employment was in tourism industries, the highest of all local authorities, with the lowest levels, only 6%, seen in Wrexham. Tables listing employment data by local authority area from 2015 to 2020 is included in Table 5.6.

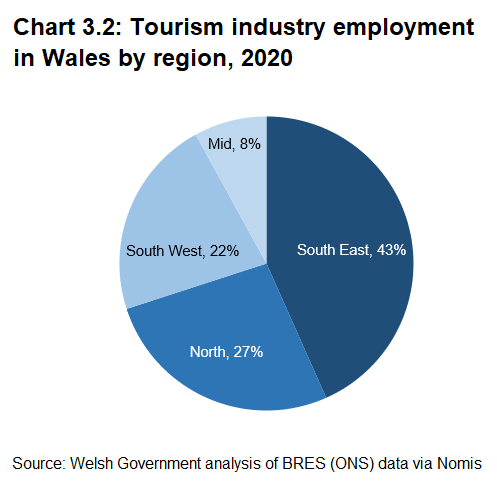
However, South East Wales accounted for by far the largest volume of tourism industry employment with 43% (65,000), and Mid Wales the smallest volume with 8% (12,000). Again, these distributions have remained very consistent over the past few years.
Readers are reminded that figures quoted here use the Business Register and Employment Survey (BRES) and may differ from employment figures estimated using other sources, such as the Annual Population Survey (APS).
See Tables 5.4 to 5.8 for full data.
Additional demographic detail on Tourism and Hospitality employment, previously been included in Priority Sector reporting, will be included in future reports.
Earnings in 2021
This section uses data from the Office for National Statistics Annual Survey of Hours and Earnings which samples employee jobs from HMRC PAYE records. Data is collected annually relating to the financial year ending in April of the reporting year. Please note 2021 earnings data is provisional.
The median hourly pay in the financial year ending April 2021 was £12.82 in Wales, but within tourism-related industries it was substantially lower. Among employee jobs in Accommodation and Food Service Activities the median hourly pay was £8.91, in Arts, Entertainment and Recreation jobs it was £9.51, and in Travel agency and tour operator activities was £9.65.
Median hourly pay for jobs in Accommodation and Food Service Activities was 6.5% higher in 2021 than in 2020. For Arts, Entertainment and Recreation jobs median hourly pay increased by 2.8%, in line with the average across all industries in Wales (2.6%).
Enterprises in 2021
This section uses information from the Inter-Departmental Business Register (IDBR), as of March each year. An enterprise is the smallest combination of legal units (generally based on VAT and/or PAYE records) which has a certain degree of autonomy within a group of legal units under common ownership.
The IDBR and Business Demography data only covers those businesses registered for VAT or PAYE, so sole traders below the VAT threshold will not be included (unless they have registered voluntarily).
Tourism enterprises (12,110) accounted for 11.3% of registered enterprises in Wales in 2021. 79% (9,600) of tourism enterprises were in hospitality, accounting for 9.0% of enterprises registered in Wales. The proportion of tourism enterprises has increased slightly in recent years, from 10.9% in 2019, though this low followed several years of slow decline, from 11.4% in 2015. Hospitality enterprise proportions followed a similar trend.
The tourism industry sub-sector accounting for the largest proportion of registered tourism enterprises was Food and Beveraging Service Activities, accounting for 7.1% of enterprises (7,585) in Wales, followed by Accommodation for Visitors with 1.5% (1,610).

Three in five (59%) tourism enterprises have fewer than 5 employees, a lower proportion than across all industries in Wales (77%).
A third (34%) of tourism enterprises have between 5 and 19 employees, a higher proportion than across all industries in Wales (18%).
Users are reminded that the IDBR only covers businesses which are registered for VAT or PAYE. It is possible that tourism and/or hospitality has a higher than average proportion of sole traders which are not VAT registered who would not appear in these figures. Other employment data sources such as the Annual Population Survey (APS) captures self-employed workers and businesses which are not PAYE or VAT registered.

In North Wales 12.2% of enterprises were in tourism industries, the highest level of all regions. The lowest incidence was in Mid Wales where only 9.5% of enterprises were in tourism industries.
There is some variation across Wales. In Gwynedd 16% of enterprises were in tourism industries, the highest proportion, compared to the lowest proportion seen in Flintshire, where only 8% of enterprises were in tourism industries. Tables showing registered enterprise data by local authority area from 2015 to 2021 is included in Table 5.13.

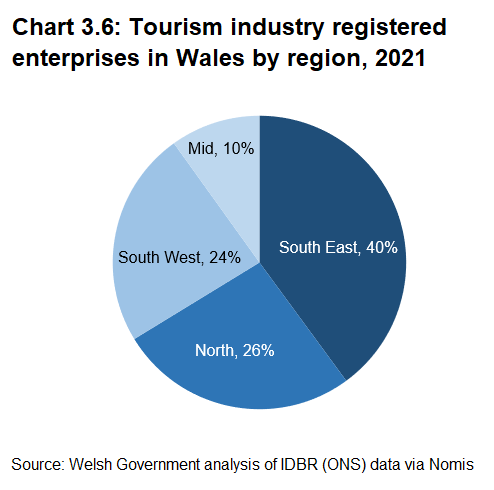
Similarly to employment distribution, the largest share of tourism enterprises in Wales was in the South East (40%) and the smallest share was in Mid Wales (10%).
See Tables 5.8 to 5.12 for full data.
Tourism Expenditure and Gross Value Added (GVA) 2019
Associated tourism expenditure
Direct expenditure generated by Tourism activity is measured through surveys of visitors to Wales. Inbound expenditure is recorded via the International Passenger Survey (IPS) conducted by the ONS and reported in their Travel Trends publication; and domestic expenditure is recorded via the Great Britain Tourism Survey and Great Britain Day Visit Survey. Regional breakdowns of associated Tourism expenditure are available in the Visit Wales Regional and Local Tourism Profiles.
2019 saw £6.0 billion of associated expenditure on tourism trips within Wales: £3,447 million on tourism day visits from GB residents, £2,003 million on overnight visits from GB residents and £515 million from inbound visitors.
Gross Value Added (GVA)
Please note 2019 GVA data is provisional. Users are reminded to note the difference between Tourism Industry definitions used for GVA when viewing these figures alongside those for employment and enterprises. Please see Definitions of Tourism Industries for further details.
Combined, the seven tourism-related industries at SIC division level accounted for 5.0% of GVA in Wales in 2019 (£3.4 billion). GVA for these SIC divisions has increased in recent years, from 4.6% of Wales GVA in 2015 (£2.7 billion).
The largest shares coming from Food and beverage service activities, which accounted for 2.2% of Wales’ GVA in 2019 (£1.5 billion), and Accommodation which accounted for 1.4% (£0.9 billion).
The combined GVA contribution is comparable to the UK figure (5.2%) though Accommodation accounted for a higher proportion in Wales whilst Travel agency & tour operator activities, and Creative, arts & entertainment activities accounted for smaller proportions in Wales than for the UK overall.
See Tables 5.13, 5.14 and 5.15 for full data.

Further resources
The Office for National Statistics (ONS) Tourism Satellite Accounts uses a System of National Accounts framework to analyse the value of tourism-related economic activity including expenditure, added value and employment.
Data on tourism performance up to 2019 including domestic and international visitor volume and expenditure, business performance and accommodation occupancy can be found in the Wales Tourism Performance reports. The most recent data on tourism business confidence can be found in the COVID-19 Tourism Business Barometer and Tourism Business Barometer.
The UK Standard Industrial Classification (SIC) is used in classifying business establishments by the type of economic activity in which they are engaged.
The volume of tourism visits, associated spending, visitor profile and behaviours are estimated using three surveys of visitors to Wales: the International Passenger Survey (IPS) conducted by the ONS, and domestic expenditure is recorded via the Great Britain Tourism Survey and Great Britain Day Visit Survey conducted by Visit Wales.
Footnotes
[1] An employee is anyone aged 16 years or over that an organisation directly pays from its payroll(s), in return for carrying out a full-time or part-time job or being on a training scheme. It excludes voluntary workers, self-employed, working owners who are not paid via PAYE. Employment includes employees plus the number of working owners. BRES figures therefore include self-employed workers as long as they are registered for VAT or Pay-As-You-Earn (PAYE) schemes. Self-employed people not registered for these, along with HM Forces and Government Supported trainees are excluded.
[2] An employee is anyone aged 16 years or over that an organisation directly pays from its payroll(s), in return for carrying out a full-time or part-time job or being on a training scheme. It excludes voluntary workers, self-employed, working owners who are not paid via PAYE.
Contact details
Views expressed in this report are those of the researchers and not necessarily those of the Welsh Government.
For further information please contact:
Jennifer Velu
Email: tourismresearch@gov.wales
Social research number: 31/2022
Digital ISBN 978-1-80364-054-9