Welsh Index of Multiple Deprivation 2019: deprivation analysis relating to young children
Analysis of Welsh Index of Multiple Deprivation (WIMD) 2019 indicator data to explore patterns of deprivation amongst young children aged 7 and under.
In this page
Introduction
The Welsh Index of Multiple Deprivation (WIMD) is the official measure of relative deprivation for small areas in Wales.
WIMD identifies areas with the highest concentrations of several different types of deprivation. The index is calculated from eight types or domains of deprivation, each compiled from a range of different indicators (or measures). See WIMD for more information.
The most recent index, WIMD 2019, uses data from 47 indicators, but this article focuses on four indicators that provide specific information on young children aged 7 and under in deprivation. These four indicators cover the domains of income, health and education and are described below.
- Income deprivation (children aged 0 to 4 living in income-deprived households), 2016-2017
- Low birth weight (live single births less than 2.5kg), 2009 to 2018 average
- Children aged 4 to 5 (reception age) who are obese, 2012-13 to 2017-18 average
- Foundation phase average point score for children aged 6 to 7, Three Academic Years 2015/16 to 2017/18 average
Please refer to our WIMD 2019 Technical report for more information on these indicators.
Here, we present a small selection of the analysis that can be done using the WIMD data, but much more is possible. More information is provided later in this article in the section on where to find WIMD data, analysis and guidance.
What is important to know?
Although WIMD is built using small area (Lower Layer Super Output Area or LSOA) level data, much of the analysis of indicators presented in this article is at the larger Middle Layer Super Output Area (MSOA) level or Local Authority level.
Numbers of young children in many LSOAs are very small, which makes extreme results more likely.
Each LSOA has a roughly equal population of between 1,000 and 3,000 people, whilst each MSOA, built from groups of LSOAs, has roughly an equal population of between 5,000 and 15,000 people
The data for different indicators are based on different years with most presented as multi-year averages, due to small numbers at the small area (LSOA) level.
All the analysis in this article is based on data prior to the covid-19 pandemic and so does not tell us about impacts of the pandemic.
However, the analyses presented here may tell us about vulnerable communities prior to the pandemic and those which may have been more likely to be impacted by the pandemic.
All of the data used for the analysis in this article have been published on StatsWales.
Main findings
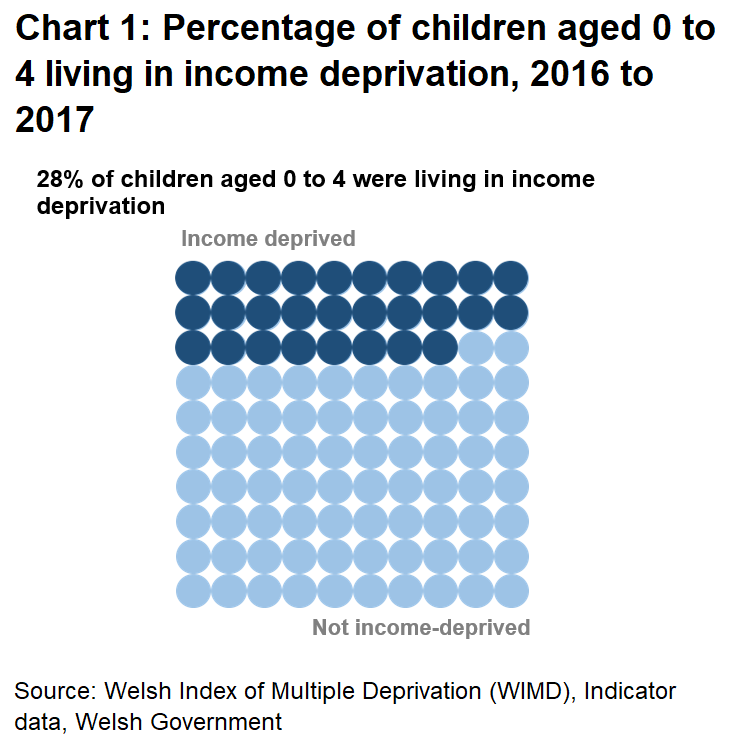
- 48,000 young children aged 0 to 4 in Wales lived in income deprivation in 2016-17. This is 28% of all children in this age group.
- Children aged 0 to 4 were most likely to live in income deprivation compared with all other age groups of children and adults.
- The proportion of young children in income deprivation in Wales decreased year on year from 30% in 2012-13 to 27% in 2015-16, however the deprivation rate has since increased slightly to 28% in 2016-17.
- Reception-aged children in the most income-deprived tenth of local areas were 76% more likely to be obese than those in the least income-deprived tenth of areas.
- Areas experiencing high levels of deprivation in one indicator were more likely to also be deprived in others, with obesity, low birth weight and education deprivation at foundation phase clearly related to income deprivation.
- The highest rates of deprivation for different indicators were spread across different local authorities.
- Income deprivation for children aged 0 to 4 was most widespread in Blaenau Gwent
- Low birth weight rates were highest in Rhondda Cynon Taf
- Reception age obesity was most common in Merthyr Tydfil
- Early education deprivation (at foundation phase) was most common in Neath Port Talbot.
Young children aged 0 to 4 in income deprivation
Across Wales around 48,000 young children aged 0 to 4 were living in income deprivation in the financial year 2016-2017. This accounts for 28% of all children in this age group. Children are counted as living in income deprivation if they are the dependent child of an adult who is claiming an income related benefit or is a supported asylum seeker. See the WIMD 2019 Technical report for more details.
As shown in Chart 2, young children aged 0 to 4 were the age group most likely to live in income deprivation in the financial year 2016-2017. This is likely to be because those caring for young children may be less able to work and have lower earnings or increased childcare costs, meaning they are more likely to claim income related benefits.

Where do young children in income deprivation live in Wales?
Income deprivation in young children is closely related to WIMD overall deprivation rankings. In the most deprived 20% of LSOAs in Wales based on WIMD overall rankings, 49% of young children were living in income deprivation. The proportion of income deprived young children decreases in the less deprived WIMD groups, but even in the least deprived 20% of LSOAs, 9% of young children (2,700 young children) still lived in income deprivation.
Rates of young children living in income deprivation also vary between local authorities. As shown in chart 3, the Local Authorities with the highest proportions of young children living in income deprivation are not always the same as the areas with the largest number of young children living in these circumstances. This is due to unequal numbers of children in each local area. Depending on what the data is being used for, it is important to consider both of these measures. This is also true at smaller geographies such as LSOAs.
Income deprivation count estimates provided in this article were calculated using published small area income deprivation indicator data split by age and the Office for National Statistics mid-2016 small area population estimates.
These local estimates are published on StatsWales with details of the method used, so the calculations can be replicated with population estimates for different years if required.

The local authority with the highest rate of income deprivation amongst young children was Blaenau Gwent, where 37% of those aged 0-4 were living in income deprivation. This amounts to approximately 1,400 young children.
The local authority with the largest number of young children living in income deprivation was Cardiff, where 6,600 children were living in these circumstances. Cardiff’s deprivation rate of 29% for this age group was slightly above the Welsh average of 28%. Rhondda Cynon Taff had a relatively high deprivation rate of 32% and had the second highest number of young children living in these circumstances when compared with other Local Authorities in Wales. There were around 4,500 income deprived 0 to 4 year olds living in Rhondda Cynon Taff in 2016-2017.
The lowest rates of income deprivation for young children were in Powys and Monmouthshire where 17% of children were living in income deprivation, although this still amounts to over 1,000 young children in Powys, and around 750 in Monmouthshire living in these circumstances.
Small area distribution of income deprivation among young children
Across LSOAs, proportions of young children in income deprivation varied from 0% to 94%. However, care needs to be taken when interpreting LSOA results as many small areas contain small numbers of children (as low as 8 children in one LSOA). This means extreme results are more likely.
Given the challenge described above, income deprivation among young children has been analysed at the MSOA level here. MSOAs are larger areas than LSOAs and in Wales contained a minimum of 160 children aged 0 to 4 in 2016 (the reference period for income deprivation data presented here).
In 2016-17, income deprivation amongst young children varied between MSOAs from 3% to 67%. Chart 4 shows the spread of deprivation between Local Authorities. The blue boxes contain the middle half of the MSOAs in each Local Authority, with the central horizontal line showing the median income deprivation rate. The vertical lines show the full range of rates in MSOAs for each local authority. Areas that are very different to the rest of the MSOAs in a local authority (known as outliers) are indicated as dots.
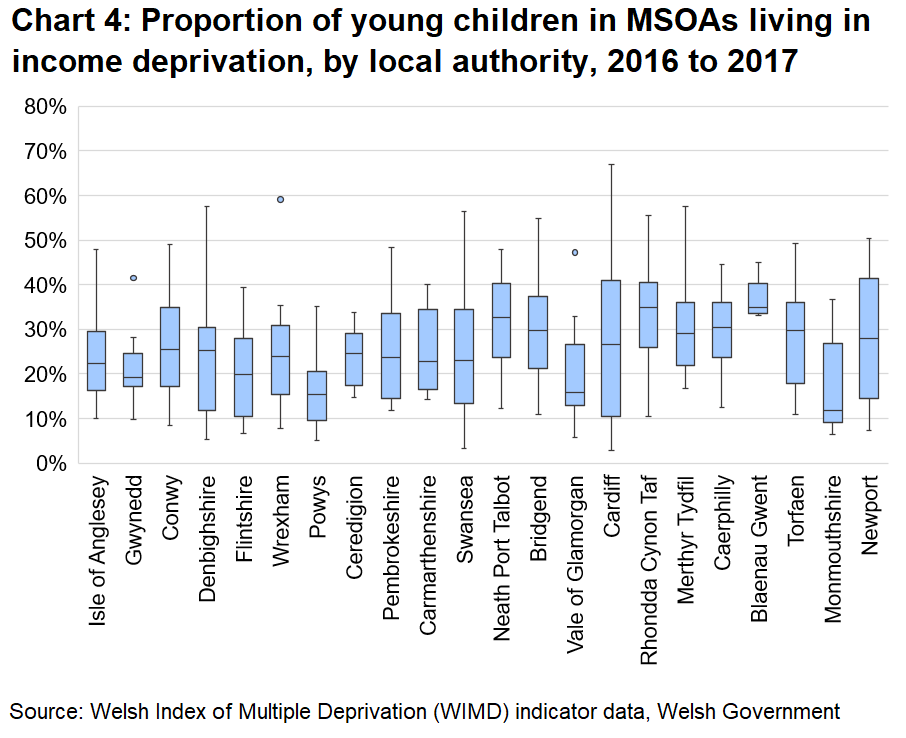
There was considerable variation in the proportion of young children living in income deprivation across MSOAs and Local Authorities. Notably:
- Blaenau Gwent was the local authority with the highest overall rate of income deprivation among children aged 0 to 4, at 37%.
- Blaenau Gwent also had the smallest variation across MSOAs, suggesting that deprivation is fairly evenly spread across the Local Authority.
- Rates of young children experiencing income deprivation were highly variable in Cardiff, which contains both the most and least income deprived MSOAs in Wales for children aged 0 to 4.
- 67% of young children in the Ely East area (‘Cardiff 039’) were living in income deprivation, compared to just under 3% in the area around Rhiwbina and Pant-mawr (‘Cardiff 004’).
- Three MSOAs are identified as outliers. In each of these cases the area has an unusually high level of deprivation compared to the rest of the MSOAs in that Local Authority.
- In Wrexham, 59% of young children in the area around Caia Park (‘Wrexham 010’) were living in income deprivation. This is substantially higher than the second-most deprived area in that local authority which had a deprivation rate of 35%. Three of the five LSOAs in Wrexham 010 were in the 10% most income deprived areas for young children in Wales, namely Queensway 1 and 2, and Wynnstay.
- In the north east of Barry in the Vale of Glamorgan, the Gibbonsdown area (‘Vale of Glamorgan 007’) had an income deprivation rate of 47% for young children, compared to 33% in its second-most deprived MSOA.
- In Gwynedd, 41% of young children lived in income deprivation in the Caernarfon East area (‘Gwynedd 006’), compared to 28% in its second-most deprived area.
Change over time
Table 1 shows the proportion of young children in income deprivation in each local authority from 2012-2013 (included in the WIMD 2014 full index update) to 2016-2017 (included in the full WIMD 2019 update). Income deprivation has been measured in the same way since WIMD was first developed, and the data is considered broadly comparable over time. However, caution is required when interpreting the reasons behind any changes over time. As income deprivation in WIMD is based on the number of people claiming certain benefits, the rates could be impacted by how benefits rules are applied in practice (for example, small changes to the welfare system can impact eligibility thresholds and criteria). See the WIMD 2019 Technical report for more information.
In Table 1, the last row, ‘WIMD indicator update year’ refers to the year the indicator data was published (as opposed to the reference period of the data) and corresponds to the ‘Year’ dimension specified in WIMD StatsWales tables. Note that full WIMD index and domain ranks were only calculated in 2014 and 2019. However some of the underlying indicator data, including income deprivation data, were updated in the interim period. For clarity, analysis in this section of the article will refer to the data years rather than the WIMD indicator update years.
| Local authority | 2012-2013 | 2013-2014 | 2014-2015 | 2015-2016 | 2016-2017 |
|---|---|---|---|---|---|
| Isle of Anglesey | 30 | 27 | 25 | 26 | 27 |
| Gwynedd | 24 | 21 | 21 | 21 | 21 |
| Conwy | 31 | 30 | 26 | 25 | 25 |
| Denbighshire | 32 | 31 | 30 | 28 | 29 |
| Flintshire | 24 | 23 | 22 | 21 | 21 |
| Wrexham | 27 | 26 | 26 | 25 | 27 |
| Powys | 20 | 19 | 18 | 17 | 17 |
| Ceredigion | 21 | 23 | 22 | 22 | 23 |
| Pembrokeshire | 28 | 27 | 26 | 25 | 26 |
| Carmarthenshire | 27 | 27 | 25 | 25 | 26 |
| Swansea | 31 | 29 | 29 | 29 | 29 |
| Neath Port Talbot | 35 | 34 | 34 | 32 | 32 |
| Bridgend | 35 | 34 | 31 | 29 | 29 |
| Vale of Glamorgan | 27 | 26 | 24 | 23 | 23 |
| Cardiff | 33 | 31 | 30 | 29 | 29 |
| Rhondda Cynon Taf | 35 | 34 | 33 | 31 | 32 |
| Merthyr Tydfil | 38 | 37 | 35 | 33 | 33 |
| Caerphilly | 32 | 31 | 30 | 29 | 29 |
| Blaenau Gwent | 41 | 39 | 37 | 36 | 37 |
| Torfaen | 35 | 33 | 31 | 30 | 30 |
| Monmouthshire | 20 | 19 | 19 | 17 | 17 |
| Newport | 35 | 33 | 33 | 30 | 30 |
| Wales | 30 | 29 | 28 | 27 | 28 |
| WIMD indicator update year: | 2014 | 2015 | 2016 | 2017 | 2019 |
Source: Welsh Index of Multiple Deprivation (WIMD), Indicator data, Welsh Government
The proportion of young children in income deprivation in Wales decreased year on year from 30% in 2012-13 to 27% in 2015-16, however the deprivation rate has since increased slightly to 28% in 2016-17.
All but one local authority (Ceredigion) followed a similar trend of decreasing rate between 2012/13 and 2015-16, but this trend reversed in the most recent data (2016-17), where deprivation either remained broadly the same or slightly increased across the board.
Comparing 2012-13 to 2016-17:
- All but two local authorities (Ceredigion and Wrexham) had lower rates of young children in income deprivation in 2016-17 compared to 2012-13.
- Wrexham’s deprivation rate decreased between 2012-13 and 2015-16, but has since increased back to the local authority’s 2012-13 rate of 27%.
- Ceredigion’s rate of young children in income deprivation increased from 21% to 23% between 2012-13 and 2016-17.
- Ceredigion is the only local authority that experienced an increase over this five-year period, although its deprivation rate remains below the average for Wales. This increase in deprivation in Ceredigion is specific to the 0 to 4 age group. For older children and adults in Ceredigion, income deprivation has either remained broadly the same or decreased over time.
- The biggest decreases in deprivation rates were seen in Bridgend and Conwy, which both experienced decreases of 6 percentage points between 2012-13 and 2016-17.
- In Bridgend the rate decreased from 35% to 29%, and in Conwy from 31% to 25%. All of this change occurred during the 2012-13 to 2015-16, with the proportions remaining steady in 2016-17.
Low birth weight
Low birth weight is classified in WIMD as a live single birth where the baby weighs less than 2.5kg. Having a low birth weight can cause health problems for children later in life. This data is in line with the low birth weight National Indicator which helps to measure progress against key well-being goals in Wales under the Wellbeing of Future Generations Act 2015 (see Wellbeing of Future Generations Act section). The figures included in WIMD 2019 are the ten year 2009-2018 average.
The risk of low birth weight (Low birth weight, Nuffield Trust) is related to:
- smoking while pregnant
- substance and alcohol misuse
- pregnancy health and nutrition
- pregnancy-related complications
- a mother's young age
Overall in Wales, 5% of babies were born with a low birth weight, amounting to a yearly average of around 1,800 babies.
At local authority level, the Vale of Glamorgan had the lowest proportion of babies born with a low birth weight, at 4%, while Rhondda Cynon Taf and Merthyr Tydfil both had a rate of 7%.
Distribution of low birth weight rates varies within and between local authorities. As shown in Chart 5, across MSOAs, Rhondda Cynon Taf had a notably wide range of low birth weight rates compared to the other local authorities, including compared to Merthyr Tydfil, which had a similarly high median rate but much lower variation. This means that in Merthyr Tydfil, high deprivation on this measure was spread relatively evenly across the local authority, whereas in Rhondda Cynon Taf some areas experienced very high deprivation while others were less deprived than the Welsh average.

This concentration of deprivation within particular areas of Rhondda Cynon Taf is clear when looking at the most deprived small areas in the country. As shown in table 2, of the ten most deprived MSOAs for low birth weight between 2008 and 2019, six are in Rhondda Cynon Taf. Due to Rhondda Cynon Taf’s high number of births, they also had a high actual number of low weight births, over 1,800, second only to Cardiff (2,100) which had a much larger total number of births (including normal weight births).
| Rank | Local authority/MSOA | MSOA Description1 | LBW indicator | Count |
|---|---|---|---|---|
| 1 | Rhondda Cynon Taf 013 | Tylorstown | 11% | 88 |
| 2 | Wrexham 010 | Caia Park | 10% | 128 |
| 3 | Denbighshire 004 | Rhyl North | 9% | 124 |
| 4 | Rhondda Cynon Taf 006 | Mountain Ash | 9% | 70 |
| 5 | Rhondda Cynon Taf 016 | Tonypandy West & Clydach Vale | 9% | 70 |
| 6 | Rhondda Cynon Taf 015 | Glyn-coch & Ynys-y-bwl | 8% | 75 |
| 7 | Rhondda Cynon Taf 020 | Porth West | 8% | 56 |
| 8 | Rhondda Cynon Taf 008 | Penrhiw-ceibr | 8% | 62 |
| 9 | Denbighshire 006 | Rhyl South West | 8% | 67 |
| 10 | Newport 014 | Stow Hill | 8% | 71 |
Source: Welsh Index of Multiple Deprivation (WIMD), Indicator data, Welsh Government
1MSOA descriptions are produced by the House of Commons Library and are included here to aid interpretation.
Across the 1909 LSOAs in Wales, low birth weight rates varied from 0% to 13% with the one notable outlier of Mountain Ash West 2 in Rhondda Cynon Taf (part of the MSOA Mountain Ash included in table 2), which had a low birth weight rate of 15%.
Relationship between low birth weight and income deprivation rates
Local areas with higher rates of income deprivation also had the highest rates of babies born with low birth weights. Babies from the most income-deprived tenth of local areas were nearly twice as likely to have been born with a low birth weight compared with babies from the least income-deprived tenth.

Children aged 4 to 5 who are obese
Carrying excess weight can have significant implications for an individual’s physical and mental health. Obesity in adults is a known risk factor of a number of serious chronic diseases and is therefore a preventable cause of premature death. Children who are overweight or obese are highly likely to remain so into adulthood.
Childhood Obesity, Senedd Wales
Across Wales, around 12% of reception aged children were obese between 2012-18, amounting to roughly 3,800 children in this year group in an average year The proportion of reception aged children (aged 4 and 5) who are obese is based on the six year 2012-13 to 2017-18 average, collected through the Child Measurement Programme (Public Health Wales).
Chart 7 shows the spread of obesity rates for each Local Authority in Wales. Data points in this analysis are Middle Super Output Areas (MSOA). This is the smallest area for which reception-age obesity data is published, due to concerns around risk of identifying individuals.
Obesity rates in reception aged children varied between local authorities. Merthyr Tydfil was the Local Authority with the highest reception age obesity rate(16%).Young children in Merthyr Tydfil were twice as likely to be obese compared to those in the Vale of Glamorgan where the equivalent rate was 8%, the lowest across local authorities.
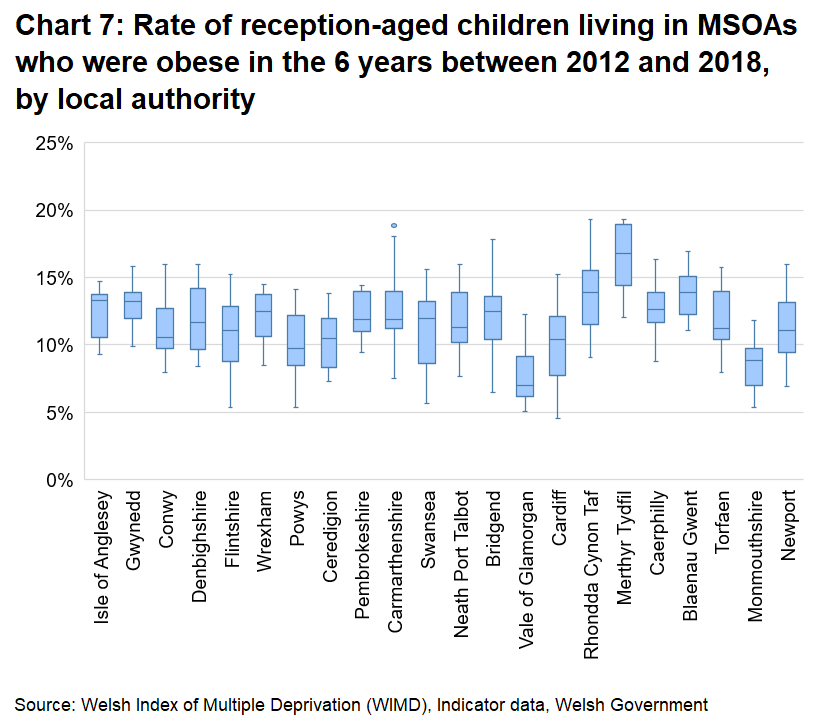
At MSOA level, reception aged obesity rates ranged from 5% to 19%. Four MSOAs had the highest rates of 19%, two in Merthyr Tydfil, one in Rhondda Cynon Taf and one in Carmarthenshire. Generally areas with high obesity rates were also relatively income deprived, however this was not the case for the MSOA ‘Carmarthenshire 023’ (the Llanelli West area), which had one of the highest reception age obesity rates in Wales (19%) but had a lower income deprivation rate than the Welsh average, for both young children and overall.
Relationship between obesity and income deprivation rates
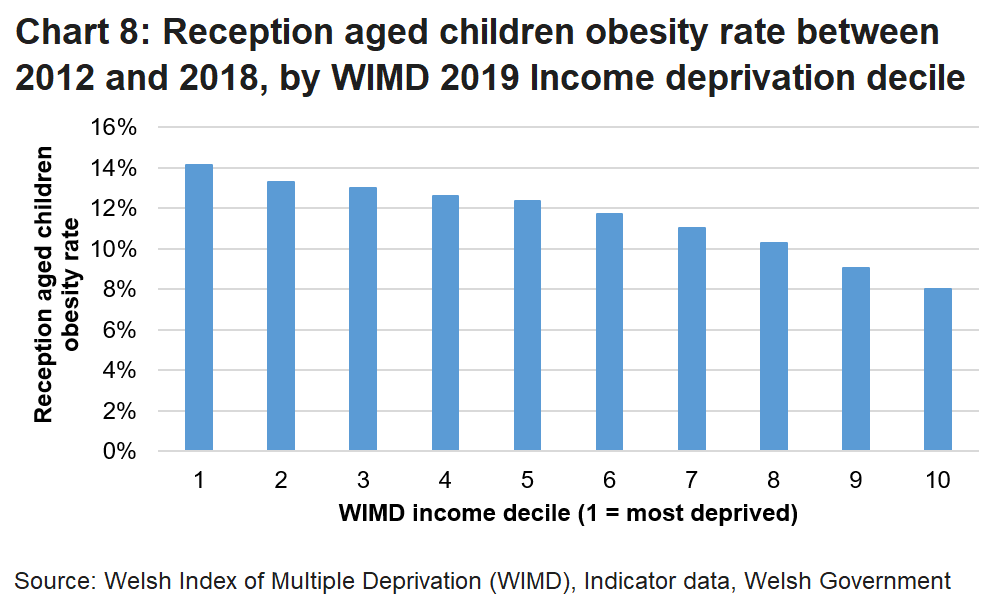
At a local area level, rates of child obesity were related to income deprivation, with children living in more income-deprived areas at greater risk of being obese. In fact, children in the most income-deprived tenth of local areas were 76% more likely to be obese compared to children in the least deprived tenth of areas.
While obesity rates for individual LSOAs cannot be reported, this analysis of the link between obesity and income deprivation has been conducted using data at the LSOA level, to make it as accurate as possible.
As shown in Chart 8, the association between income deprivation and obesity was stronger in the less deprived half of LSOAs, with a drop of 2 percentage points between the 1st and 5th decile, compared to a drop of 4 percentage points between the 6th and 10th decile.
Early education deprivation: foundation phase average point score
WIMD includes several indicators related to the educational participation and attainment of different age groups. One of these is the foundation phase average point score, which is based on a teacher assessment taken when children are aged six to seven. This is the youngest age group included in the WIMD education indicators and can be used to identify areas with high levels of educational deprivation for young children. The data included in WIMD is based on pupils’ postcodes, so relate to where they live rather than where they go to school.
The score relates to the performance of children in language, literacy and communication (English or Welsh), maths, and personal and social development. A maximum of 135 points per child is possible across the three areas of development, however this would be unusual as it would indicate the child is performing well above what is expected of their age group in all three of the areas of development. The expected performance level used as an indicator by Welsh Government, achievement of Outcome 5 or above, would result in a score of 99.
The foundation phase average point score included in WIMD 2019 is a three year average for academic years 2015/16, 2016/17 and 2017/18. Across these years, the average foundation phase point score in Wales was 104. At local authority level, average points varied from 101 for pupils living in Neath Port Talbot, to 107 for pupils living in Monmouthshire.
Early year’s education deprivation is widespread in Neath Port Talbot, where all MSOAs scores were at or below the Welsh average for foundation phase education. The most deprived MSOA in Neath Port Talbot for early education is the Glyncorrwg and Blaengwynfi area (Neath Port Talbot 011), where the average point score is 93.
As shown in Table 3 however, the most deprived areas for early education are spread across several local authorities, with multiple MSOAs from Cardiff and Swansea also featuring among the 10 most deprived areas.
| Rank | Local authority/MSOA | MSOA description(1) | Foundation phase average points score |
|---|---|---|---|
| 1 | Cardiff 032 (a) | Cathays South & Bute Park | 87 |
| 2 | Neath Port Talbot 011 | Glyncorrwg & Blaengwynfi | 93 |
| 3 | Cardiff 036 | Adamsdown | 94 |
| 4 | Gwynedd 016 | Barmouth & Dolgellau | 97 |
| 5 | Swansea 011 | Penderry | 98 |
| 6 | Swansea 019 | Townhill | 98 |
| 7 | Rhondda Cynon Taf 013 | Tylorstown | 98 |
| 8 | Carmarthenshire 026 | Llanelli South | 98 |
| 9 | Neath Port Talbot 002 | Dulais Valley | 98 |
| 10 | Swansea 021 | St Thomas | 99 |
Source: Welsh Index of Multiple Deprivation (WIMD), Indicator data, Welsh Government
(1) MSOA descriptions are produced by the House of Commons Library and are included here to aid interpretation.
(a) MSOA Cardiff 032 had a small number of pupils included in the foundation phase average point score figure compared to the other MSOAs in this table. This small number means extreme scores are more likely, so the large gap in score between this area and the other deprived areas may not be significant.
Relationship between foundation phase average points score and income deprivation
On average, children in areas with high levels of income deprivation obtain lower points scores at foundation phase. In the least income deprived tenth of LSOAs, the average points score was 108, compared to only 101 in the most income deprived tenth.

Where to find WIMD data, analysis and guidance
All WIMD 2019 indicator data can be accessed on StatsWales. Data published before 2019 can be seen in the archive section with metadata below each table view.
Below signposts the data that are analysed in this article. Data for other WIMD indicators and geography aggregations are available in the locations linked in the paragraph above.
Location of indicator data analysed in this report
Income deprivation rates for different age groups, 2019
Geography aggregations
- Local authority
- MSOA
- Economic regions
- Local health board
- Constituency area
- Rural-Urban settlement classifications
- Built-up area
- LSOA
StatsWales: income deprivation by age
Income deprivation count estimates (5-year age bands), 2019
Geography aggregations
- LSOA
- Local authority
- Wales
StatsWales: indicator data by age
Income deprivation rates for different age groups, 2014 to 2017
Geography aggregation
- Local authority
Statswales: income deprivation by age (archive)
Low birth weight (live single births less than 2.5kg) (%), 2019
Geography aggregations
- LSOA
- Wales
StatsWales: indicator data, health domain
Geography aggregations
- Local authority
- MSOA
StatsWales: indicator data, all domains
Children aged 4 to 5 who are obese (%), 2019
Data on child obesity are not published at the LSOA level due to concerns around possible misuse of smaller area data and risk of identifying individuals.
Geography aggregations
- Local authority
- MSOA
- Wales
StatsWales: indicator data, all domains
Foundation Phase Average Point Score, 2019
Geography aggregations
- LSOA
- Local authority
- MSOA
- Wales
StatsWales: indicator data, all domains
For further information on WIMD indicator data and how to use it please refer to our guide to analysing indicator data. This guide provides detail on the indicator data, how it can and can’t be used and which data can be analysed overtime. It also provides a case study which works through an example of a problem that can be solved by analysing WIMD data.
If you are interested in creating your own analysis of indicator data, our geography lookups found on StatsWales will support this. The lookups enable you to link different geography aggregations together (for example, match MSOAs with Local Authorities as is seen in the box plot charts in this article).
More examples of how to draw insights from WIMD indicator data can be seen in our slideshare reports. These can be found in the WIMD indicator data update (2017) but please bear in mind that this analysis does not use the most up-to-date indicator data available.
Future data updates
Although full WIMD index and domains ranks are only updated every 3 to 5 years, some of the underlying indicators may be updated in the interim period. The indicator data updates aim to provide more up-to-date information to those interested in analysing deprivation for areas and/or age groups, allowing some analysis over time and comparison between areas.
During the coronavirus pandemic in 2020 and 2021, we have not provided updates to indicator data published as part of the WIMD 2019 index publication. The decision to delay indicator data updates at this time was taken in consideration of the limited usefulness of possible updates, other continuing uncertainties and resource implications (for data suppliers and for Welsh Government). The reasons are described in full on our WIMD pages.
We are currently continuing to publish follow-on outputs for WIMD 2019, offer WIMD awareness sessions, and undertake longer-term development work on key indicators ahead of the next index update (timing not yet determined).
Please refer to our WIMD 2019 list of outputs for a full list of WIMD 2019 publications, including what is to come.
Reference table: indicator data for young children by local authority
| Local authority | Children aged 0 to 4 in income deprivation (%) | Low birth weight (%) | Children aged 4 to 5 who are obese (%) | Foundation phase average point score |
|---|---|---|---|---|
| Isle of Anglesey | 27 | 5.5 | 12.7 | 104 |
| Gwynedd | 21 | 5.0 | 13.0 | 105 |
| Conwy | 25 | 5.1 | 11.4 | 104 |
| Denbighshire | 29 | 6.1 | 12.2 | 104 |
| Flintshire | 21 | 5.4 | 11.2 | 105 |
| Wrexham | 27 | 6.4 | 12.4 | 104 |
| Powys | 17 | 4.7 | 10.5 | 106 |
| Ceredigion | 23 | 4.8 | 10.5 | 106 |
| Pembrokeshire | 26 | 5.2 | 12.5 | 103 |
| Carmarthenshire | 26 | 5.4 | 12.8 | 104 |
| Swansea | 29 | 5.4 | 12.0 | 103 |
| Neath Port Talbot | 32 | 5.2 | 11.9 | 101 |
| Bridgend | 29 | 5.3 | 12.5 | 105 |
| Vale of Glamorgan | 23 | 4.4 | 8.1 | 106 |
| Cardiff | 29 | 4.8 | 10.2 | 104 |
| Rhondda Cynon Taf | 32 | 6.8 | 13.5 | 103 |
| Merthyr Tydfil | 33 | 6.6 | 16.4 | 104 |
| Caerphilly | 29 | 5.7 | 12.7 | 105 |
| Blaenau Gwent | 37 | 6.2 | 13.7 | 103 |
| Torfaen | 30 | 5.6 | 12.1 | 105 |
| Monmouthshire | 17 | 4.7 | 8.6 | 107 |
| Newport | 30 | 5.6 | 11.3 | 104 |
| Wales | 28 | 5.5 | 11.8 | 104 |
The data for these indicators are based on different years with most presented as multi-year averages. See introduction section for reference periods of each indicator.
Quality information
National Statistics status
The United Kingdom Statistics Authority has designated these statistics as National Statistics, in accordance with the Statistics and Registration Service Act 2007 and signifying compliance with the Code of Practice for Statistics.
National Statistics status means that official statistics meet the highest standards of trustworthiness, quality and public value.
All official statistics should comply with all aspects of the Code of Practice for Statistics. They are awarded National Statistics status following an assessment by the UK Statistics Authority’s regulatory arm. The Authority considers whether the statistics meet the highest standards of Code compliance, including the value they add to public decisions and debate.
It is Welsh Government’s responsibility to maintain compliance with the standards expected of National Statistics. If we become concerned about whether these statistics are still meeting the appropriate standards, we will discuss any concerns with the Authority promptly. National Statistics status can be removed at any point when the highest standards are not maintained, and reinstated when standards are restored.
The continued designation of these statistics as National Statistics was confirmed in July 2020 following a compliance check by the Office for Statistics Regulation. These statistics last underwent a full assessment against the Code of Practice in December 2010.
Since the latest review by the Office for Statistics Regulation, we have continued to comply with the Code of Practice for Statistics.
Well-being of Future Generations Act (WFG)
The Well-being of Future Generations Act 2015 is about improving the social, economic, environmental and cultural wellbeing of Wales. The Act puts in place seven wellbeing goals for Wales. These are for a more equal, prosperous, resilient, healthier and globally responsible Wales, with cohesive communities and a vibrant culture and thriving Welsh language. Under section (10)(1) of the Act, the Welsh Ministers must (a) publish indicators (“national indicators”) that must be applied for the purpose of measuring progress towards the achievement of the Well-being goals, and (b) lay a copy of the national indicators before Senedd Cymru. The 46 national indicators were laid in March 2016.
Information on the indicators, along with narratives for each of the wellbeing goals and associated technical information is available in the Wellbeing of Wales report.
This release includes one contextual indicator, namely Low Birth Weight which was referenced in the technical document or the Well-being report in the previous link.
Further information on the Well-being of Future Generations (Wales) Act 2015.
The statistics included in this release could also provide supporting narrative to the national indicators and be used by public services boards in relation to their local wellbeing assessments and local wellbeing plans.
Contact details
Statistician: Samantha Collins
Tel: 03000 25 7371
Email: stats.inclusion@gov.wales
Media: 03000 25 8099
![]()
SFR 256/2021