This report provides an update on progress being made in Wales towards the achievement of the 7 wellbeing goals

First published: 29 September 2022
Last updated: 29 September 2022

Foreword

Foreword by the Chief Statistician

The annual Well-being of Wales report provides a valuable opportunity for a well-rounded look at our nation’s progress towards the seven well-being goals. This year’s report comes at a turbulent time. Whilst the peak of the coronavirus pandemic may have passed, its impact is still profoundly felt. In addition, the cost of living crisis and the invasion of Ukraine create uncertainty and anxiety both at home and internationally. At the time of writing, these events are still evolving and it will take many years before their full impact is known (although where possible we have commented on them in this report).

Over two years on from the start of the pandemic, we can now monitor a wider range of its impacts and also see whether the change it created is persisting. For example, we saw some positive shifts in topics such as community cohesion and local decision-making early in the pandemic. Although the latest data shows some of these measures are starting to fall back, they are still above pre-pandemic levels. Could this be an example of sustained change or, in time, will they return to their previous levels?

It is clear there have been impacts on many elements of our national well-being. The Healthier Wales chapter of this report highlights slow progress towards the well-being goal, with worsening mental wellbeing in both adults and older children particularly noteworthy this year. One of the themes that emerged from last year’s report was the number of examples of widening inequalities. This continues to be a feature this year, with few signs of the gaps reversing. The cost of living crisis has compounded the challenges posed by the very low growth in living standards, driven by very weak growth in productivity, as experienced across the UK since around the time of the financial crisis. The is expected to exacerbate inequalities further, with people on low incomes likely to be particularly affected.

But there are also signs of positive change. In the area of fair work, the full-time gender pay gap is at its lowest level, there are recent increases in people on permanent contracts who are paid the real living wage, and more people now have their pay set through collective bargaining. In the most recent year, the number of low birth weight babies fell for the first time since 2014. And greenhouse gas emissions have continued to improve (helped by the impact of the pandemic) and the amount of waste that isn’t recycled continues to fall.

New national indicators and milestones

At the end of 2021, an updated set of national indicators was laid before the Senedd, expanding the set from 46 indicators to 50. New topics such as justice, housing affordability, transport and digital inclusion were added for the first time, alongside some changes to existing national indicators. This year’s Wellbeing of Wales report presents data on some of these new and updated indicators for the first time. I look forward to reporting on more of these indicators as new data sources become available over the coming years.

This year’s report is also the first to cover progress towards the national milestones. The milestones are generational targets which describe the pace and scale of change needed in key areas under the seven well-being goals. The first nine national milestones were set in late 2021, with eight more in development. Analysis from this year’s report shows mixed progress across the first nine milestones, with positive long-term progress on the gender pay gap, employment rate, qualifications and greenhouse gas emissions, but either stagnation, deterioration or a less clear trend for other milestones.

How do you use this report?

This year the Wellbeing of Wales report has been given National Statistics status. This means it has been independently assessed as meeting the highest standards of trustworthiness, quality and value. We want to make sure we keep living up to these standards and, if you’re reading this report, you can help us do this. We want to hear about how you use the report and the national indicators, what you like about it and what you’d like to see improved. If you’d like to contribute, we plan to use the Shaping Wales’ Future blog to keep you updated and seek your views .

Stephanie Howarth
Chief Statistician

Main points

Main points

As across the UK as a whole, the growth in the economy and in real incomes has been sluggish since the recession of 2008, reflecting weak productivity growth. Over the longer run, since 1999, Wales has broadly kept pace with the UK as a whole, but its performance continues to be weak compared with many other parts of the UK. 

The historic gaps in employment and activity rates between Wales and other parts of the UK have narrowed, with Wales out-performing some English regions. This represents a marked change from the period prior to devolution in the 1980s and 1990s.

There has been little change in overall relative income poverty levels in Wales for over 15 years. Wales has more people in low paid work than some other parts of the UK, but there have been recent increases in the share of people on permanent contracts who are paid the real Living Wage.

The qualification profile of the Welsh working age population has been improving over time. In 2021, 62.5% of working age adults in Wales were qualified to the level 3 threshold. This is an increase from just over a half in 2011.

The recycling rate continued to increase with nearly two-thirds of municipal waste reused, recycled or composted in 2020-21. The amount of municipal waste generated was the lowest on record.

The latest comprehensive assessment of Welsh natural resources (SoNaRR) shows that overall, biological diversity is declining. Most habitat types have seen a reduction in diversity over the last 100 years, with the rate of decline increasing from the 1970s onwards.

Life expectancy fell in the most recent period available (2018 to 2020), which includes part of the period of the COVID-19 pandemic. Healthy life expectancy continues to be worse for those living in more deprived areas but has remained relatively stable between 2011 to 2013 and 2018 to 2020.

The majority (93%) of adults reported following two or more of the five healthy lifestyle behaviours. The percentage of children with two or more healthy lifestyle behaviours remains at 88%, broadly unchanged since data collection started in 2013/14. 

Mental wellbeing for both adults and children is lower than prior to the pandemic, according to the most recent assessment.

Nearly half (49%) of single parents were in material deprivation in 2021-22 and 2% of households said they had received food from a food bank during 2021-22.

Girls continue to achieve better educational outcomes at GCSE. In summer 2021, girls were awarded more grades at A* to C than boys.

Latest estimates show that for the first time in Wales, the proportion of the population stating they had no religion was higher than the proportion identifying as Christian.

The (full-time) gender pay gap was 5.0% in 2021, unchanged on the previous year and the lowest rate ever recorded. The disability pay gap, which rose between 2014 and 2019 now appears to be reducing, though the employment situation during the COVID-19 pandemic may have had an impact on this trend.

There has been an increase in people feeling that they can influence decisions in their local area which continues to reverse the downward trend seen prior to the pandemic.

Community cohesion remains above pre-pandemic levels, although reported hate crimes continued to increase in the latest year.

The pandemic has continued to have a large negative impact on attendance at arts and cultural events and there has been mixed progress in sport participation.

Survey data showed an increase in the percentage of people who speak Welsh in the latest year. The National Survey for Wales shows that 11% of Welsh speakers are fluent.

More museums and archive services are meeting accredited standards. 63% have now reached this benchmark, up from 59% in 2017.

In 2020, it was estimated that emissions totalled 33 million tonnes of carbon dioxide (CO2) equivalent, a fall of 40% since the base year (1990).

The National Survey for Wales reported 11% of adults have done three or more of the four following actions to help with global issues: donating or raising money, campaigning, volunteering, or changing what they buy.

General quality issues

Annual Population Survey (APS) data published in March 2022 has been used throughout this year’s Wellbeing of Wales report. ONS published updated APS data in mid-September. This included planned revisions to historical data, and corrections to an earlier error identified with the grossing factors for some age groups. The fully revised data set was available too late for inclusion in this report. However, the impact on overall totals is minimal, and none of the overall trends are affected. National indicator web pages will be updated with the latest data during Autumn 2022. 

In May 2020, due to the COVID-19 (coronavirus) pandemic the National Survey for Wales changed mode from a face-to-face interview to one over the telephone. The wording of some questions was also changed to better suit the mode. For these reasons it is not always possible to make direct comparisons across years but, where relevant, results from previous years are included throughout this report to add context.

A prosperous Wales

The goal for a prosperous Wales

Authors: Jonathan Price and Luned Jones

An innovative, productive and low carbon society which recognises the limits of the global environment and therefore uses resources efficiently and proportionately (including acting on climate change); and which develops a skilled and well-educated population in an economy which generates wealth and provides employment opportunities, allowing people to take advantage of the wealth generated through securing decent work.

What have we learnt from the data in the last year?

The effects of the pandemic, and more recently, the war in Ukraine, have dominated other factors impacting economic outcomes, including the transition to a new trading relationship with the European Union.

Many of the national indicators included in this chapter relate to earlier years and do not yet reflect the more recent effects of these factors. However, other more timely data sources show that a major effect of the pandemic and the war in combination has been to raise inflation very sharply, with adverse consequences for living standards. This has particularly affected people on low incomes who spend more than average on food and energy.  

Latest data for the UK show that real wages are falling (employee average regular pay fell 2.8% over the year after adjusting for inflation). ONS experimental statistics have shown that lower income groups have recently experienced higher than average rates of inflation.

At the time of writing the evolution of the cost of living crisis is highly uncertain, depending heavily on external circumstances, and particularly the Ukraine conflict.  In addition, the UK Government could put in place further measures which mitigate some of the effects.

Recent research and analysis, including by the Bank of England, has indicated that negative effects on economic activity of the shift to new trading relations with the European are already identifiable, though many of the consequences will play out only over time.    

Underlying Welsh economic performance continues to be weaker than the UK as a whole in terms of economic output (gross value added) and household income (gross disposable household income and median household income), but is broadly similar to those parts of the UK with similar features and characteristics.

Labour market data is volatile over the short term and it is important not to over-interpret recent changes, particularly in the context of the pandemic.  With this caveat, labour market data suggests the pandemic has impacted Welsh economic performance in a way that is broadly similar to the UK (excluding London).

While Welsh performance on pay and productivity remains less positive than labour market performance, data indicates modest improvements in Wales’ relative productivity over the last decade, reversing deterioration prior to the recession of 2008.

It is too soon to assess the effects of the pandemic on young people, though early evidence indicates that they have been disproportionately affected by the socio-economic consequences. There is evidence in particular that the disruptive effects on education have affected young people from disadvantaged backgrounds. Depending on the effectiveness of mitigations in place, the adverse effects could play out in the labour market over coming years or even decades.

A new national milestone on participation in education and the labour market was set in 2021 which is that at least 90% of 16 to 24 year olds will be in education, employment, or training by 2050. Provisional estimates for 2020, show an increase in young people’s participation in education and the labour market driven by increased participation in education or training. It is too soon to assess the impact of the pandemic on this trend.

A new national indicator on the proportion of employees whose pay is set by collective bargaining was introduced in December 2021 based on data from the Annual Survey of Hours and Earnings. 57% of employees were covered by collective bargaining arrangements in 2021, where pay and conditions are negotiated between an employer and a trade union. This is slightly higher than in recent years.

In April 2021, the (full-time) gender pay gap was 5.0%, unchanged on the previous year and the lowest rate ever recorded. 

The qualification profile of the Welsh population has been improving over time, though there were some changes to longer term trends in 2021. There continues to be an improvement in the share of people qualified at higher levels, but there was also an increase in the proportion of adults with no qualifications.

Children from deprived backgrounds continue to have poorer outcomes than other groups. Girls continue to outperform boys.

What is the longer term progress towards the goal?

Progress towards the goal has been mixed, with major improvements in overall labour market performance but less progress in addressing poverty, low productivity and pay, and low income levels. Progress has been made on decarbonisation, but more rapid change will be needed in future to meet targets.

The pandemic and the war in Ukraine have had a dominant effect on the most recent data, and the implications for longer term trends is unclear. For this reason, the following conclusions are drawn mainly on the basis of pre-pandemic evidence.

As across the UK as a whole, the growth in the economy and in real incomes has been sluggish since the recession of 2008, reflecting weak productivity growth. Over the longer run, since 1999, Wales has broadly kept pace with the UK as a whole, but its performance continues to be weak compared with many other parts of the UK.

Average household incomes in Wales are considerably closer to the UK average than gross value added (GVA) per head, with differences depending on the measure used and with the gap smallest when assessed for the median household.

The national milestone on employment (based on the Annual Population Survey) is to eradicate the gap between the employment rate in Wales and the UK by 2050, with a focus on fair work and raising labour market participation of under-represented groups. The historic gaps in employment and activity rates between Wales and other parts of the UK have narrowed, with Wales out-performing some English regions. This represents a marked change from the period prior to devolution in the 1980s and 1990s.

Wales has more people in low paid work than some other parts of the UK.   In addition, the evidence on other aspects of the quality of work suggests a mixed picture in Wales. 

The qualification profile of the Welsh working age population has been improving over time. One of the national milestones on qualifications is that 75% of working age adults in Wales will be qualified to level 3 or higher by 2050. In 2021, 62.5% of working age adults in Wales were qualified to the level 3 threshold. This is an increase from just over a half in 2011. The other national milestone on qualifications is that the percentage of working age adults with no qualifications will be 5% or below in every local authority in Wales by 2050. In 2021, three of Wales’ 22 local authorities have 5% or less of working age adults with no qualifications.

Attainment in secondary schools rose in the years before the pandemic, although children from deprived backgrounds still have poorer outcomes.

Management of the interaction between economic growth and the development of an innovative, low carbon economy is complex and poses challenges, but there are positive signs in some sectors. 

Travel makes a substantial contribution to carbon emissions, but there is no evidence of a shift away from cars as the main method of travel.
The pandemic appears to have accelerated the trend to remote economic activity, including working from home. The longer-term consequences are uncertain. Increased home working and internet retail may increase the challenges faced by some urban centres. Evidence from the UK as a whole indicates that the greater scope for home working may have encouraged more women to participate in the labour market.

UK data indicates that road traffic has recovered to levels similar to those seen before the pandemic (albeit with a small reduction in car travel offset by an increase in goods traffic). However, public transport (both rail and bus) remains at a level that is well below that observed prior to the pandemic.

Economic performance

As across the UK as a whole, the growth in the economy and in real incomes has been sluggish since the recession of 2008, reflecting poor productivity growth. 

Immediate prospects also appear poor, with high inflation reducing real incomes and the prospects of an economic slowdown and perhaps a recession.

Over the longer run, since 1999, and taking economic indicators in the round, Wales has broadly kept pace with the UK. While its economic performance continues to be weak compared with many other parts of the UK, productivity data over the last decade gives some grounds for optimism. However the gap with the UK as whole remains large, and the UK itself does not perform strongly when compared internationally.

Gross value added (GVA) represents the value of all goods and services produced in an area. It is both the source of the real incomes people earn and the base on which taxes can be levied to fund public services. 

While GVA per head of population in Wales has grown broadly in line with the UK since 1999, it remains lower than almost all other countries and regions of the UK. 

Looking at progress more recently, GVA per head in Wales fell faster in 2020 than across the UK as a whole. It decreased by 3.8%, compared to 3.4% for the UK (not accounting for inflation).

Economic data does not yet permit a definitive assessment of Wales’s comparative economic performance over the course of the pandemic. In broad terms the relative scale of the impact looks similar in Wales to the UK as a whole. Performance on GVA per head is mainly a reflection of relatively low productivity levels. Productivity, measured as GVA per hour worked continues to be lower in Wales than almost all other parts of the UK. In 2020 it was 84.3% of the UK figure, an increase of 0.2 percentage points over the previous year. 

Data covering the most recent decade confirms modest improvements in relative productivity (GVA per hour worked), perhaps reversing a trend of deterioration prior to the recession.

Image
Line chart showing the gross value added (GVA) per head in Wales has grown broadly in line with the UK since 1999. GVA per head in Wales fell faster in 2020 than across the UK as a whole.

Household income

Household income is a better indicator of people’s prosperity and material wellbeing than GVA. Average household incomes in Wales are considerably closer to the UK average than GVA per head, but there are differences depending on the measure used, with the gap narrowest when median incomes are considered. Data is currently available only up until 2019, so this section focuses on longer run trends.

The national indicator on income uses the measure gross disposable household income (GDHI). On this measure Wales, according to the most recent data (2019), is at 81% of the UK figure, having fallen from 88% at its peak in 2003. This relative fall has partly been driven by a steep increase in household incomes in London, which has helped to drive up the UK average.

Whilst Wales has the second lowest GDHI per head of the UK countries and regions, it is broadly comparable to areas of the UK with similar characteristics.

Image
The line chart shows that gross disposable household income (GDHI) per head increased for Wales and the UK between 1999 and 2019, with the gap widening slightly.

Labour market

Over the last year, changes in the Welsh labour market have been driven by the effects of the pandemic and, more recently, the war in Ukraine. Taking a longer term perspective, the labour market in Wales continues to perform strongly in relative terms, with the gap between Wales and the UK narrow in comparison with the historic position.

The Labour Force Survey (LFS) remains the main source for headline labour market indicators at a Wales level. The larger sample of the Annual Population Survey (APS) allows for estimates at a local authority level and for sub-groups of the population and is the source for the national indicators and related national milestones. As most labour market data is survey-based and volatile, short term changes should not be over-interpreted.

In broad terms, according to the LFS, over the last year the unemployment rate decreased, showing some recovery from the impact of the pandemic. However, the employment rate has decreased and economic inactivity has also increased. The gaps in employment and activity rates between Wales and the UK remain narrow in a historical context, with Wales out-performing a number of UK regions. 

The national milestone on employment (based on the APS) is to eradicate the gap between the employment rate in Wales and the UK by 2050, with a focus on fair work and raising labour market participation of under-represented groups. According to the APS, the employment rate for people aged 16 to 64 in Wales was 73.1% in the year ending December 2021 whilst the UK rate was 74.7%. Since 2001, the employment rate has increased by 6.0 percentage points in Wales and by 2.4 percentage points in the UK.

COVID-19 has had adverse labour market effects which have disproportionately affected groups that were already disadvantaged. This includes people in low paid jobs, in less secure employment, young people, people reaching the end of their working lives, and people in various groups that were already experiencing labour market inequalities. Further analysis of the impact on inequalities is included in the More Equal Wales chapter. 

Data from more timely administrative sources indicates that the labour market in Wales has generally tracked with wider UK (excluding London) during the pandemic. Data from the PAYE Real Time Information shows that the number of paid employees has generally increased in recent years, but fell during the pandemic. The number of paid employees began increasing again at the end of 2020 and is now above the pre-pandemic level. This data set does not include those that are self-employed. 

Image
The rates in both Wales and the UK dipped during 2020 and early 2021, but have since increased slightly.

Note that the national indicator and milestone uses data from the Annual Population Survey which is based on a larger sample, but less timely.

Image
A line chart showing a general decrease in the economic inactivity rate for people aged 16-64 for Wales and the UK between 1999 and 2020, with more recent increases for Wales.

Participation in education and the labour market

A new national milestone on participation in education and the labour market was set in 2021 which is that at least 90% of 16 to 24 year olds will be in education, employment, or training by 2050.

Provisional estimates for 2020, the first covering any period of the pandemic, show an increase in young people’s participation in education and the labour market driven by increased participation in education or training. It is too soon to assess the longer term impact of the pandemic on this trend. 

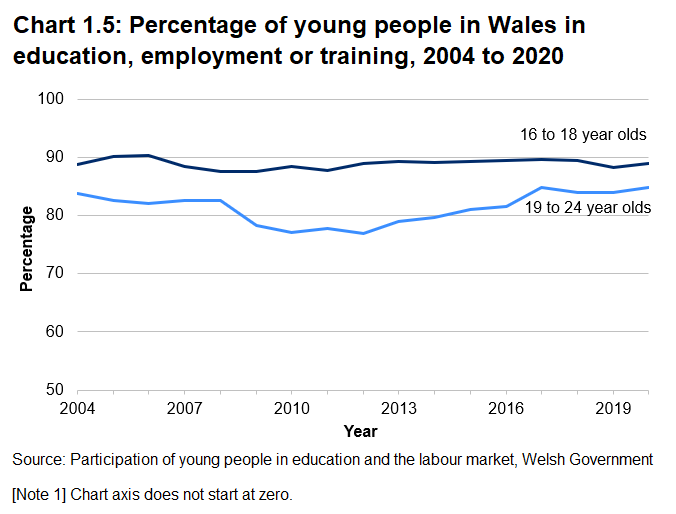
Using the main measure of young people in education, employment or training, there had been decreases in both the 16 to 18 and 19 to 24 age groups between 2017 and 2019. The proportion for both groups then increased in 2020. For 16 to 18 year olds, this followed a period where the proportion remained stable at around 89 to 90% between 2012 and 2018.

The effect of the 2008 recession was felt more sharply by the 19 to 24 age group. Since then and up to 2017, the share in education or the labour market gradually increased. At the end of 2020, the first increase since 2017, the rate stood at 84.8%, nearly 8 percentage points higher than in 2012.

For the 16 to 24 age group as a whole, 86% were in education, employment or training in 2020.

More recent figures on young people in education, employment or training are available from a secondary, less robust source. These suggest a decrease in participation in 2021, more so for the 16 to 18 age group.

Image
Line chart showing the percentage of people aged 16-18 in education, employment or training has remained around 89-90% for the past 15 years, with the equivalent proportion of 19-24 increasing in the years leading up to the pandemic

Fair work and earnings

A new national indicator on the proportion of employees whose pay is set by collective bargaining was introduced in December 2021, based on data from the Annual Survey of Hours and Earnings. Some 57% of employee jobs were covered by collective bargaining arrangements in 2021, where pay and conditions are negotiated between an employer and a trade union. This is higher than in recent years. It is also considerably higher than for each of the other UK countries and England regions and reflects the relatively higher share of employees in Wales who work in the public sector and in manufacturing.

One of the national indicators on fair work and earnings was amended in December 2021 and now considers the percentage of people in employment, who are on permanent contracts (or on temporary contracts, and not seeking permanent employment) and who earn at least the real Living Wage. The real living wage is calculated by the Living Wage Foundation who determine the methodology. It aims to reflect the cost of living. 

In 2021, 70% of those people on permanent contracts (or on temporary contracts, and not seeking permanent employment) earned at least the real Living Wage, the same proportion as in 2020, and higher than in the previous six years. This is based on the real Living Wage for 2021/22 as published in November 2021.

Image
Bar chart showing the percentage of people in employment, who are on permanent contracts (or on temporary contracts, and not seeking permanent employment) and who earn at least the real Living Wage. In 2021, 69.6% of people in employment met this definition, similar to 2020.

Data from the National Survey for Wales suggests that the percentage of people satisfied with their job remains broadly unchanged, standing at 82% in 2019-20. Job satisfaction tends to increase with age.

A new national milestone has been set, to eliminate the pay gap for gender, disability and ethnicity by 2050. Over the long-term, the gender pay gap (on a median hourly full-time basis and excluding overtime) has narrowed. In April 2021, the (full-time) gender pay gap was 5.0%, unchanged on the previous year and the lowest rate ever recorded. The gap widened in the UK to 7.9%. 

The gender pay gap for all employees remains considerably higher at 12.3%. This is because women fill more part-time jobs, which in comparison with full-time jobs have lower hourly median pay.

These gaps do not take into account differences in education levels and experience, which vary across genders and affect earning levels.

Image
Line chart showing the percentage difference in earnings between men and women has generally decreased for Wales and the UK since 1999, with a lower gap in Wales than in England in recent years.

Poverty and deprivation

The 2020-21 data collection process for the DWP Family Resources Survey was impacted by COVID-19. Because of this, for many breakdowns of estimates of income poverty and material deprivation (including for Wales) it is not possible to make meaningful statistical assessments of trends and changes. Therefore, the latest poverty and material deprivation statistics for 2020-21 relate to the UK overall only, and are subject to more uncertainty than usual.

People living in relative income poverty are those who live in a household where the total household income from all sources is less than 60% of the average UK household income (as given by the median). There was a reduction in UK median household income between 2019-20 and 2020-21, and changes in UK household income (before housing costs) varied across the income distribution.

  • The household incomes of individuals in the bottom quarter of the income distribution recorded positive real terms income growth.
  • Those between the 30th and 80th percentiles recorded a reduction in real incomes.
  • There was a more mixed picture for the highest income quintile.

The percentage of UK individuals in relative low income decreased both before and after housing costs in 2020-21. The pattern was similar for the different age groups of children, working age adults, and pensioners.

Material deprivation is a measure of living standards, and a person is defined to be living in material deprivation if he or she is not able to access a certain number of goods and services. Low income households are those that had a total household income below 70% of the UK average household income, before housing costs were paid. Across the UK, in the year to 2020-21, a fall in material deprivation was recorded for pensioners, and in the measures of combined low income and material deprivation for children. However, the introduction of coronavirus (COVID-19) pandemic restrictions impacted on the measurement of material deprivation which means that recorded levels are not directly comparable with previous years.

A person is considered to be in persistent poverty if they are in relative income poverty in at least 3 out of 4 consecutive years. Data from the Understanding Society survey shows that an individual in Wales had a 12% likelihood of being in persistent poverty between 2016 and 2020 (after housing costs were paid). A child in Wales had a slightly higher likelihood of being in persistent poverty at 13%.

A national indicator on the percentage of households spending 30% or more of income on housing costs was added to the national indicator set in December 2021, based on data from the Family Resources Survey. Across all tenures, for the latest financial years for which data is available (2017 to 2020) 19.4% of households spend 30% or more of their income on housing costs. This percentage has been fairly consistent over the period 2011-12 to 2019-20, but varies by housing tenure. 

Qualifications

The qualification profile of the Welsh population has been improving over time, though there were some changes to longer term trends in 2021.

Skills and qualifications are the biggest single influence on people’s chance of being in employment and on their incomes.

Latest data shows there continues to be an improvement in the share of people qualified at higher levels. In 2021, 41.6% of working age adults were qualified to at least higher education level (known as NQF level 4), nearly 14 percentage points higher than when statistics were first produced on the 18 to 64 working age adults definition in 2008.

One of the national milestones on qualifications is that 75% of working age adults in Wales will be qualified to level 3 or higher by 2050. In 2021, 62.5% of working age adults in Wales were qualified to the level 3 threshold. This is an increase from 51.3% in 2011.

Over the last decade, there have been large falls in the share of working age adults with no qualifications, though this proportion increased from 7.4% in 2020 to 8.1% in 2021. The proportion of working age adults qualified to at least level 2 (equivalent to 5+ GCSEs at grade A* to C) also decreased in 2021 to stand at 80.1%, down from 80.9% in 2020.

Older adults are more likely to have no qualifications than younger adults.

There are higher proportions of males than females with no qualifications in nearly all age groups. Females are more likely to hold qualifications at or above level 4.

Image
Line chart showing that between 2008 and 2021, qualification levels in Wales have gradually increased along with a corresponding drop in the proportion of working age adults with no qualifications. There was a slight increase in the proportion with no qualifications in 2021.

The other national milestone on qualifications is that the percentage of working age adults with no qualifications will be 5% or below in every local authority in Wales by 2050. In 2021, three of Wales’ 22 local authorities have 5% or less of working age adults with no qualifications; Ceredigion (2.8%), Monmouthshire (3.0%), and the Vale of Glamorgan (3.1%). The proportion of working age adults with no qualifications was highest in Merthyr Tydfil (20.1%) and Blaenau Gwent (15.3%). 

Image
Bar chart showing the variation in the proportion of working age adults with no qualifications between local authorities. The proportion ranges from 2.8 per cent in Ceredigion to 20.1 per cent in Merthyr Tydfil.

Attainment in schools

Attainment in schools rose in the years prior to the pandemic, although children from deprived backgrounds still have poorer outcomes.

In the 2021/22 academic year 54% of pupils aged 4 were at a stage of development in mathematics that would be consistent with or greater than their age according to the Foundation Phase framework, with 87% of pupils within one stage of the development consistent with their age. In language, literacy and communication in English 53% of pupils were at a stage of development that would be consistent with or greater than their age, with 85% of pupils within one stage of the development consistent with their age. These figures are lower than in 2019. The picture is different for language, literacy and communication in Welsh, where 27% of children were at a stage consistent with their development. This is due to children from non-Welsh speaking families being enrolled in Welsh medium schools.

At GCSE there remains a gap in educational outcomes of children in school eligible for free school meals and those who are not. The gap in entries achieving A* to A grades at GCSE has widened in the last six years, with the gap in entries achieving A* to C grades being relatively stable. Data up to 2019 indicates that at earlier stages of school the gap widens as pupils get older.

In 2020/21, the gap between pupils not eligible for free school meals (FSM) and pupils eligible for FSM awarded GCSE grades A* to A widened to 21.3 percentage points, from 17.8 percentage points in 2019/20. The gap had previously been relatively stable at around 14.7 percentage points between 2015/16 and 2018/19 before widening in the most recent 2 years.

In 2020/21 the gap between pupils not eligible for FSM and pupils eligible for FSM awarded grades A*to C widened to 27.3 percentage points, returning to a gap similar in size to the years leading up to the pandemic after a fall to 24.7 percentage points in 2019/20.

Following the cancellation of public examinations in summer 2020 and summer 2021, all grades that would have been awarded following an examination were replaced with the centre assessed or determined grade.

Image
A line chart showing the gap between percentages of students eligible for free school meals and students not eligible for free school meals achieving A*-A, A*-C, and A*-G at GCSE in 2020/21. In all 3 areas there has been an increase in the gap between pupils, with a steeper increase for students achieving A*-A.

Greenhouse gas emissions from business

Managing the interaction between economic growth and an innovative, low carbon economy is complex and poses challenges, but there are positive signs.

Overall, greenhouse gas emissions have fallen by 39.2% since the base year (1990). It accounted for over a quarter of Welsh emissions (26%). Emissions from this sector have decreased substantially since 1990 (by 32%).

Historically, the business sector has been the second largest source of greenhouse gas emissions (after the energy supply sector). However, in 2020 the business sector was the largest source of emissions following a decrease in emissions from the energy supply sector. This was driven by a reduction of natural gas combustion (mainly from a reduction in output from Pembroke power station), reduced emissions from petroleum refining and the closure of Aberthaw power station in 2020 marking the end of coal-fired energy generation in Wales.

Image
Line chart showing a significant decrease in Greenhouse Gas Emissions from business in Wales around 1999-2002 and has remained relatively stable in recent years.

Mode of travel

Some forms of travel make a substantial contribution to carbon emissions, but there is no evidence yet of a shift away from cars as the main method of travel by road.

Major declines in travel have occurred during the pandemic with UK data suggesting this affected all modes other than walking and cycling. Road traffic volume in Wales decreased by 23.4% in 2020. The number of journeys undertaken on local bus services dropped by 71.4%, and the total distance travelled by local bus services in 2020-21 decreased by 36.0% compared to the previous year.

More timely UK data indicates that road traffic has recovered to levels similar to those seen before the pandemic (albeit with a small reduction in car travel offset by an increase in goods traffic). However, public transport (both rail and bus) remains at level that is well below that observed prior to the pandemic.

A national indicator on the percentage of journeys by walking, cycling or public transport was added to the national indicator set in December 2021. This data will be sourced from a National Travel Survey for Wales which is currently under development. In the short-term, data from the Labour Force Survey on usual mode of travel to work can be considered.

As in most other parts of the UK outside London, private road transport remains the dominant mode of travel and accounts for the overwhelming majority of commuting journeys in Wales. In 2020, 83% of commuters in Wales used a car as their usual method of travel. This is slightly higher than in the previous 5 years, but likely to have been due to COVID-19.

Image
Pie chart showing that the vast majority (83%) of people in Wales travelled to work by car in 2020, 9% walked, with the remainder travelling by bus, rail or bicycle.

In the National Survey (online survey) 2020-21, people were asked about environmental behaviours as part of every day life. 30% of people avoided or cut down travelling by plane and 39% avoided or cut down travelling by car. Of those reducing car travel, a quarter said that concerns about pollution/limiting the effects of climate change was the main reason and a quarter said that helping them keep fit was the main reason. Cost was given as the main reason for 18%. However, there is yet no evidence of such behaviours resulting in an identifiable change in overall travel patterns.

There has been a considerable increase in the number of newly registered ultra-low emissions vehicles in Wales in recent years, with the number increasing nearly five-fold between 2019 and 2021, to over 6,000. At the end of 2021, there were over 14,000 licensed ultra-low emission vehicles registered in Wales. 

Over time, reduced reliance on petrol and diesel vehicles and increased use of ultra-low emission vehicles could contribute to a reduction in emissions.

Further reading

Previous versions of the Wellbeing of Wales report include further analysis of relative income poverty.

Labour market overview, provides a monthly update on the Welsh labour market.

The Welsh economy in numbers dashboard shows trends in the key economic outcomes for Wales, compared to the UK.

Transport Statistics Great Britain (Department of Transport) is an annual compendium of transport statistics, including data for Wales on a number of topics.

Data sources

Economic performance

Regional gross value added (balanced) per head and income components (Office for National Statistics)

Regional and sub-regional productivity in the UK: July 2022 (Office for National Statistics)

Household income

Gross disposable household income (Office for National Statistics)

Regional gross disposable household income, UK statistical bulletins (Office for National Statistics)

Labour market

Regional labour market statistics in the UK Statistical bulletins (Office for National Statistics)

Earnings and employment from Pay As You Earn Real Time Information, seasonally adjusted (Office for National Statistics)

Participation in education and the labour market

Estimated 16 to 24 year olds not in education, training or employment by economic activity and age groups (StatsWales)

Fair work and earnings

Calculate the Real Living Wage (Living Wage Foundation)

Percentage of people moderately or very satisfied with their jobs by age (StatsWales)

Proportion of employees whose pay is set by collective bargaining (Annual Survey of Hours and Earnings)

Percentage of people in employment, who are on permanent contracts (or on temporary contracts, and not seeking permanent employment) and who earn at least the real Living Wage, 2012 to 2021 (StatsWales)

Gender pay difference in Wales by year (median hourly earnings full-time employees excluding overtime) (StatsWales)

Poverty

Relative income poverty ( Department for Work and Pensions)

Material deprivation ( Department for Work and Pensions)

Persistent poverty, Understanding society (Department for Work and Pensions)

Qualifications

Highest qualification levels of working age adults by year and qualification

Education

Academic achievement of pupils in Foundation Phase baseline assessment and at Key Stage 3, 2022

Examination results: September 2020 to August 2021

Businesses

Emissions of greenhouse gases by year (StatsWales)

Travel

Transport Statistics: Great Britain 2021 (Department for Transport)

Road Traffic, 2020

Public service vehicles (buses and taxis): April 2020 to March 2021

Ultra-low emission vehicle statistics (Department for Transport)

A resilient Wales

The goal for a resilient Wales

Author: Luned Jones

A nation which maintains and enhances a bio-diverse natural environment with healthy functioning ecosystems that support social, economic and ecological resilience and the capacity to adapt to change (for example, climate change).

What have we learnt from the data in the last year?

Many of the national indicators used to measure progress towards this goal are long-term indicators that measure gradual change. These indicators are therefore updated periodically rather than annually.

From those national indicators updated within the last year:

  • there was a small increase in the proportion of surface and ground water bodies achieving a good or better status in 2021
  • average concentrations to which people are exposed, of nitrogen dioxide and particulate matter decreased between 2019 and 2020; annual variations can be due to a number of factors including the weather
  • there was a considerable decrease in the amount of waste generated, that is not recycled, per person, between 2012 and 2019
  • the recycling rate continued to increase with nearly two-thirds of municipal waste reused, recycled or composted in 2020-21; the amount of municipal waste generated was the lowest on record
  • installed electrical capacity and installed heat capacity from renewable energy both increased slightly, though at a slower rate than in recent years; the amount of renewable electricity generated is over a half (56%) of electricity consumed in Wales

What is the longer term progress towards the goal?

Data for some of the national indicators suggest that progress is being made towards the resilient Wales goal. These include long term improvements to air quality, increased renewable energy capacity, decreases in waste generation and considerable improvements in recycling rates. However, other indicators show that overall, biological diversity is declining and that most habitat types have seen a reduction in diversity during the past hundred years.

The latest comprehensive assessment of Welsh natural resources (SoNaRR) shows that overall, biological diversity is declining.

Most habitat types have seen a reduction in diversity over the last 100 years, with the rate of decline increasing from the 1970s onwards.

The quality of our water whether in seas, rivers, streams or the ground is generally improving.

Air quality has improved greatly since the 1970s, but remains a risk to human health.

Wales has seen decreases in waste generation and considerable improvements in recycling rate, but we continue to use up resources faster than they can be replenished.

Installed electrical capacity from renewable energy continues to increase but at a slower pace than in recent years.

As well as the national indicators, the SoNaRR 2020 report provides a comprehensive assessment of progress against the four aims of the sustainable management of natural resources.

Biodiversity

The loss of biodiversity is accelerating globally and at unprecedented rates in human history. Although there have been improvements in the status of populations of some species in Wales, SoNaRR 2020 shows that, overall, biodiversity is declining. An experimental indicator on the Status of Biological Diversity in Wales published in 2021 showed that the distribution of species in Wales has declined over the long term but has been stable more recently. Further analysis on this topic is available in the Wellbeing of Wales report 2021.

In addition to the national indicator on biodiversity, there are schemes in place which monitor specific species. The UK Butterfly Monitoring Scheme is a long-term monitoring scheme. Trends for UK butterfly species vary, with about a third of butterfly species assessed in the UK showing a significant long-term decline in abundance (34%), compared to 29% showing a significant long-term increase. However, over the last decade the majority of species are stable, with 7 species (13%) showing a statistically significant increase and no species showing a significant decline.

Main drivers responsible for long-term declines in abundance include changes in the extent, condition and fragmentation of habitats caused by the intensification of farming, changes in forestry practices, urban development, pollution and climate change. Some drivers, such as climate change, are likely to have mixed, species dependent impacts.

The Breeding Bird Survey is a citizen science monitoring scheme that has been running since 1994. Across the UK, 39 species have shown statistically significant long-term increases, and 43 species have significant long-term declines. Population increases include the expansion of recent colonists and non-native species. In Wales, 17 species have statistically significant long-term increases and 14 species have significant long-term declines.

Habitats and soil

Most habitat types have seen a reduction in diversity over the last 100 years, with the rate of decline increasing from the 1970s onwards.

In the 2019 Wellbeing of Wales report we reported that 31% of our land was considered semi-natural. This national indicator is used to assess the proportion of our land that has semi-natural, less modified habitats as these are most likely to form healthy and resilient ecosystems. An updated indicator will be available in 2023.

The Marine Protected Area network covers 50% of Wales’ inshore and offshore waters and protects a representative suite of marine habitats and species. Ensuring the favourable condition of these sites is therefore key to achieving overall resilience of Welsh seas. In January 2018, NRW published indicative condition assessments for marine Special Areas of Conservation and Special Protection Areas in Wales. 46% of marine features were assessed to be in favourable condition, 45% were assessed to be in unfavourable condition and 9% were unknown, with underpinning confidence levels assigned to each assessment.

Natural Resources Wales published the Terrestrial and Freshwater Protected sites baseline assessment in 2021. Around half of the features on these sites had enough information to be assessed. An estimated 20% of all features are favourable condition; around 30% are in unfavourable condition and around 50% are not in a desired state.

Well managed soil will safeguard food production, support habitats, help manage flood risk and reduce water treatment costs. The national indicator on soil shows that the concentration of carbon in our soil is generally stable, apart from in habitat land where a loss of carbon has recently been observed.

Water quality and flood risk

The quality of our water whether in seas, rivers, streams or the ground is generally improving.

Water is one of Wales’s natural resources which we rely on constantly including for drinking water, the economy, industry, sewage treatment and agriculture.

In 2021-22 Welsh Water and Hafren Dyfrdwy provided around 900 megalitres per day (Ml/d) of potable water to meet demand, with higher demand experienced during peak periods such as during hot dry weather or tourism hot spots. Private water supplies (not on mains) is estimated as 13.8 Ml/d.

At overall status across Wales, 40% of 933 surface and ground water bodies were at good or better status in 2021. This represents a 3 percentage point increase from that reported in 2015 and an 8 percentage point improvement since 2009.

Good quality bathing waters are very important for coastal communities, visitors and the economy in Wales. Bathing water quality is monitored at 105 designated sites around Wales’ coast. In 2021, for the fourth season running, all Welsh bathing waters met the standards set by the Bathing Water Directive. 85 were classified as excellent, 14 achieved good and 6 were classified as the minimum, sufficient, standard.

Image
Pie chart showing that the vast majority (81%) of bathing waters in Wales were assessed as excellent in 2021.

The latest flood risk assessment shows that some homes in Wales are at risk of flooding from seas, rivers and surface water, with some properties at risk from more than one type of flooding.

In 2019, nearly 42,000 properties in Wales were at high or medium risk of flooding from rivers and over 60,000 properties at high or medium risk of tidal flooding. This covers both residential and non-residential properties. Of these, over 20,000 benefit from river flood defences and over 50,000 from tidal flood defences. It’s currently not possible to consider trends over time due to changes in methodology.

Air quality

Air quality has improved greatly since the 1970s, but remains a risk to human health.

The national indicator on nitrogen dioxide(NO2)emissions shows that overall, the average concentration levels to which people are exposed have been declining over the past decade. After a period of relative stability between 2017 and 2019 (at around 9 µg/m3), the average concentration decreased to 7 µg/m3 in 2020. This is consistent with reduced levels of road traffic during the COVID-19 restriction.  Average concentrations to which people are exposed of particulate matter (PM10 and PM2.5) also decreased between 2019 and 2020.

The highest concentrations of nitrogen dioxide emissions are found in urban areas and near busy roads, reflecting the contribution of traffic and urban activities to poor air quality.

Air pollution has a significant effect on public health. There are currently 44 air quality management areas declared in Wales. One was designated due to the risk of PM10 particulate matter levels exceeding the daily 24-hour mean air quality objective for PM10, and the remainder designated where levels of NO2 exceed or risk exceeding the air quality objectives for NO2.

Public Health Wales estimates the burden of long-term air pollution exposure to be the equivalent of 1,000 to 1,400 deaths (at typical ages) each year.

Image
Line chart showing that air quality has improved greatly since the 1970s, though has remained relatively stable in recent years.

Waste and recycling

Wales has made considerable progress in managing waste over the last decade by increasing the amount sent for recycling, and reducing the amount sent for disposal. Wales is a world leader in household recycling, but we continue to use up resources faster than they can be replenished.

here was a considerable decrease in the amount of waste generated, that is not recycled, per person, between 2012 and 2019 (from 794kg to 523kg). The amount of waste not recycled decreased for each of the three components that comprise this national indicator:

  1. household waste
  2. industrial and commercial waste
  3. construction and demolition waste

Total waste generation in the industrial and commercial sectors decreased between the 2012 and 2018 surveys, with two-thirds of this waste prepared for re-use, recycling and composting.

Total waste generation in the construction and demolition sectors was similar in 2012 and 2019 surveys, with a small increase in the proportion of waste prepared for re-use, recycling and composting.

The amount of local authority municipal waste generated in Wales has gradually decreased since the early 2000s, with a 3% decrease between 2019-20 and 2020-21, to the lowest reported figure to date. Care should be taken in comparing the 2020-21 results with previous years since it is not clear which effects are short term because of the pandemic and which are longer term. 

Wales is recognised as having the highest household recycling rate in the UK, and the latest data shows that nearly two-thirds (65.4%) of local authority municipal waste was reused, recycled or composted in 2020-21, similar to the proportion a year earlier.

Image
Bar chart showing the percentage of municipal waste reused/recycled/composted in Wales generally increased from 32.4% in 2012-13 to 65.4% in 2020-21.

As part of the National Survey 2021-22, people were asked about environmental behaviours as part of everyday life. Nearly a half (46%) of people minimised the purchase of brand-new items. Of these, nearly a third (30%) cited cost as the main reason, over a half (54%) either didn’t need to buy so many new things, or preferred mending and buying second hand. A further 15% gave limiting the effects of climate change as their main reason for minimising the purchase of new items.

The vast majority of people (92%) have either sold or given away items in the previous 12 months, with most methods of selling or giving away items showing an increase since the questions were last asked in 2018-19. Two-thirds of people have either received or bought second-hand items in the last 12 months (an increase from 57% in 2018-19).

Renewable energy generation

The capacity of renewable energy projects in Wales (electricity and heat) has nearly quadrupled over the last decade, though progress has slowed in recent years.

Around 33% of electricity generated in Wales was from renewable sources in 2020. The amount of renewable electricity generated is the equivalent of approximately 56% of electricity consumed in Wales.

At the end of 2020, the installed electrical capacity for renewable energy was 3,417 megawatts (MW). This is 1% higher than the previous year and more than twice the capacity in 2012. Wind power makes up nearly 59% of renewable electrical capacity and 69% of renewable electricity generation.

Wales generates 67% more electricity than it consumes, making it a net exporter of electricity.

At the end of 2020, the total renewable heat capacity in Wales was 716 MW. This is 4% higher than the previous year and more than twelve times the heat capacity in 2012.

Image
A bar chart showing an overall considerable increase in both renewable electrical and heat capacity in Wales between 2012 and 2020.

According to the National Survey for Wales, 62% of people minimised the use of energy in their home. Of these, cost was the reason given by 62% of people. A quarter of people stated that limiting the effects of climate change was a reason for minimising the use of energy. These questions were asked prior to the recent energy price rises.

Further reading

Previous versions of the Wellbeing of Wales report include further analysis of:

  • flooding
  • fuel poverty
  • semi-natural habitats
  • biodiversity
  • green spaces
  • quality of soil
  • energy efficiency of homes

State of Natural Resources Report 2020 (Natural Resources Wales) provides a comprehensive assessment of the extent to which natural resources are being sustainably managed.

National Survey for Wales provides data on people’s views on environmental issues.

Nature Positive 2030 evidence report: produced by the Joint Nature Conservation Committee, Natural England, Natural Resources Wales, NatureScot and the Northern Ireland Environment Agency. 

Natural Resources Wales: Wales Environmental Information Portal

Data sources

A healthier Wales

The goal for a healthier Wales

Author: Dr William Perks

A society in which people’s physical and mental wellbeing is maximised and in which choices and behaviours that benefit future health are understood.

What have we learnt from the data in the last year?

Data covered in this chapter now all captures the impact of at least a period of the coronavirus (COVID-19) pandemic.

Life expectancy fell in the most recent period available (2018-20), which includes part of the period of the COVID-19 pandemic .

Life expectancy is higher for women, however the proportion of life spent in good health is higher for men.

Recent analysis (based on 2018 to 2020) shows that the gap in healthy life expectancy between the most and least deprived has remained wide but relatively stable.

In 2021, there were 36,135 deaths from all causes, a decrease compared to the high number of deaths seen in 2020. COVID-19 was the sixth highest cause of death in the year-to-date.

The avoidable mortality rate for Wales in 2020 was higher than all years since 2012.

The number of live births increased marginally; the first year that the number has not fallen since 2010.

Pregnant women’s healthy lifestyle behaviours at initial assessment was mixed, with a lower percentage of women self-reporting as smokers, but a higher percentage recorded as obese or with a mental health condition than the previous year.

The majority (93%) of adults reported following two or more of the five healthy lifestyle behaviours. The percentage of children reporting this hasn’t changed. 

Both adults and 11 to 16 year olds reported lower levels of wellbeing during the pandemic, compared to results from prior. 

Data on life satisfaction and anxiety levels, which covers most of the first year of the pandemic (2020-21), saw levels deteriorating to worse than those seen in 2011-12. More recent data from the National Survey for Wales 2021-22 suggests life satisfaction may have generally returned to pre-pandemic levels.

What is the longer term progress towards the goal?

Limited progress appears to have been made towards achieving the goal, with many of the healthier Wales national indicators remaining relatively stable and not showing significant change over the periods in which they are available. However, many of the indicators do not yet cover a long enough time period or at sufficient frequency to discern a long term trend. 
The pandemic has had a dominant effect on many of the trends in the most recent data, and the implications for longer term trends is unclear. For this reason, the following long term conclusions are drawn mainly on the basis of pre-pandemic evidence.

Life expectancy had been rising since the Second World War, although at a slower pace in the past decade. However, it has fallen for the most recent period, likely reflecting the impact of the COVID-19 pandemic.

Healthy life expectancy continues to be worse for those living in more deprived areas but has remained relatively stable between 2011-2013 and 2018-2020. 

Over the long-term age-standardised mortality rates (ASMRs) have been improving, falling from 1,406 deaths per 100,000 people in 1994 to 1,062 deaths per 100,000 people in 2021. This has been negatively impacted in the latest two years due to the increased numbers of deaths associated with the pandemic.

The proportion of babies born with a low birth weight has remained relatively steady over the course of the time series, typically fluctuating between 5% and 6%, though has seen a slight upward trend in recent years, following the lowest figures in 2014 and 2015.

Due to the change in the mode of the National Survey for Wales, it’s not possible to consider recent trends for healthy lifestyle measures for adults. Prior to the pandemic, between 2016-18 and 2019-20 there was no significant change in the proportion of adults who reported two or more healthy lifestyle behaviours.

The national milestone is to increase the percentage of children with two or more healthy behaviours to 94% by 2035 and more than 99% by 2050. The data shows the percentage of children meeting the national milestone remains at 88% in the 2019 academic year and has remained stable since data collection started in the 2013/14 academic year. 

Adult average mental wellbeing decreased for the period covering July 2021 to January 2022 compared to 2018-19, which itself was a slight increase compared with 2016-17. However, due to the difference in collection mode and possible real change due to the pandemic, it is difficult to draw longer term comparisons for this indicator. 

School Health Research Network Student Health and Wellbeing survey data collected for 11 to 16 year olds prior to the COVID-19 outbreak showed little change in mental wellbeing from previous years. However, as for adults, more recent data collected in September to December 2021 indicates a fall in the average score for 11 to 16 year olds compared to prior to the pandemic. 

Average life satisfaction had been increasing since 2011-12, with slight reductions in average anxiety levels. However, the year prior to the pandemic, saw a slight deterioration in levels of both life satisfaction and anxiety. This trend continued in the first year of the pandemic with life satisfaction and anxiety levels deteriorating to levels worse than those seen in 2011-12. More recent data from the National Survey for Wales 2021-22 suggests life satisfaction may have generally returned to pre-pandemic levels.

Hazardous housing conditions have improved in the last 10 years. The most recent Welsh Housing Conditions Survey showed that 82% of dwellings were free from the most serious (category 1) hazards in 2017-18, compared with 71% in 2008. There were improvements in all tenures.

Life expectancy

Life expectancy had been rising since the Second World War, although at a slower pace in the past decade.

Analysis shows that for both males and females, people aged around 60-84 years were the main contributors to increasing life expectancy, but these improvements have slowed down considerably.

Life expectancy fell in the most recent period available (2018-20), which includes part of the period of the COVID-19 pandemic, compared to the previous period (2017-2019).

Life expectancy at birth was 82 years for women and 78 years for men for 2018-20. This was a slight reduction for both males and females, following higher death rates in 2020 during the COVID-19 pandemic.

Healthy life expectancy was 62 years for females and 61 years for males in 2018 to 2020.

Image
Line chart showing increases in life expectancy for males and females have stalled in recent years. However, it has fallen for the most recent period, reflecting the impact of the COVID-19 pandemic.

Causes of deaths

In 2021, there were 36,135 deaths from all causes, a decrease compared to the high number of deaths seen in 2020.

The five-year average for 2022 has been provided for 2016 to 2019 and 2021, providing an up-to-date comparison that is still close to representing a usual (non-pandemic year), but not including the exceptionally high number of deaths seen in 2020. 

The highest number of deaths in the year-to-date (January to July 2022) were from ischaemic heart diseases, followed by dementia and Alzheimer's disease. COVID-19 was the sixth highest cause of death in the year-to-date after being the leading cause of death in 2020 and the second leading cause of death in 2021.

Age-standardised mortality rates (ASMRs) allow for comparisons over time and area because they account for the population size and age structure. 

Over the long-term ASMRs have been improving, falling from 1,406 deaths per 100,000 people in 1994 to 1,062 deaths per 100,000 people in 2021. This has been negatively impacted in the latest two years due to the increased numbers of deaths associated with the pandemic. 
In 2021, the ASMRs were significantly higher for males (1,234.6 deaths per 100,000 males) than for females (916.6 deaths per 100,000 females).

In 2020, the avoidable mortality rate for Wales was statistically significantly higher than all years since 2012. Around two thirds of avoidable deaths were attributed to preventable conditions, and one third to treatable conditions. 

Looking at broad groupings of cause of death, the leading cause of avoidable mortality was neoplasms. COVID-19 was the 3rd leading cause. 

In 2021, there were 322 drug poisoning deaths registered in Wales, of these 210 were drug misuse deaths. The general trend in drug poisoning and drug misuse deaths in Wales has been upwards since the first statistics in 1993. The figures for 2021 are the second highest on record for drug poisoning (almost reaching the high of 2018), and the highest on record for drug misuse. 

These figures are based on the year in which the death was registered, rather than when it occurred. Because of registration delays, around half of these deaths will have occurred in years prior to 2021. Delays in death registrations, which increased during the COVID-19 pandemic, are likely to have affected the figures.

Drug deaths were more common among men than women and higher rates of drug poisoning deaths were found in more deprived areas.

Over the long-term suicide rates have fluctuated from year to year but have generally been falling. 2021 registrations showed suicide rates (12.7 per 100,000 people) were higher (though not statistically significant) than 2020 but similar to levels seen in years before the pandemic. The increase in 2021 compared with 2020 is likely to reflect disruption to coroners’ inquests caused by the pandemic and so delays in death registrations. The latest figures include deaths that occurred in 2020 and were subsequently registered in 2021.

Although a slight increase was seen in 2020 rates of alcohol specific deaths have stayed relatively stable in recent years.

Image
Dumbbell chart showing top 10 causes of death in the year-to-date, compared with the 2016-2019 and 2021 average

Inequalities in life expectancy and mortality

Inequalities in life expectancy and mortality remain wide.

Recent analysis (based on 2018 to 2020) shows that the overall gap in healthy life expectancy between the most and least deprived has remained relatively stable between 2011-2013 and 2018-2020. In the most recent time period this gap seems to have reduced slightly for males (13.3 years) and increased slightly for females (16.9 years).

The life expectancy gap is much narrower at 7.6 years for males and 6.3 years for females. But has been generally increasing in recent years for males and females, suggestive of growing inequality.

Further breakdowns of the gap in life expectancy and healthy life expectancy by health board and local authority can be seen on the Public Health Wales Health expectancies in Wales with inequality gap profile. 

Males spend more of their life in good health (78.5%) compared to females (76.0%).

The proportion of total deaths that were avoidable continued to be substantially larger in the most deprived areas compared with the least deprived areas, with avoidable deaths accounting for 37.0% of all male deaths in the most deprived areas compared with 18.9% in the least deprived areas. For females the equivalent figures were 25.7% in the most deprived areas and 14.1% in the least deprived areas.

The absolute gap in avoidable mortality between the most and least deprived areas has widened to the highest level since 2003 for males and since the data time series began for females.

Avoidable mortality rates with COVID-19 as an underlying cause of death were statistically significantly higher in the most deprived areas compared with the least deprived areas.

Image
Line chart showing absolute gap in life expectancy and healthy life expectancy for males and females between 2011-2013 to 2018-2020

The gap in health expectancies is calculated as the absolute difference between the least and most deprived fifths. This is a change of method since previous health expectancies releases, to improve the stability of the measure at local authority level. The gap was previously calculated using the Slope Index of Inequality (SII). The Office for National Statistics continue to publish the SII at national level as part of their Health state life expectancies release.

Low birth weight babies

The percentage of low birth weight babies has remained relatively steady over the course of the time series, typically fluctuating between 5% and 6%.

The lowest figures on record were recorded in 2014 and 2015. Since then there has been a slight upward trend in the number of low birth weight babies with 2020 being the highest on record before falling back again in 2021.

In 2021, a slightly higher percentage of female babies had low birth weight (6.2%) compared to male babies (5.3%). This is broadly consistent with the longer-term trend.

The proportion of live births with low birth weight or low gestational age was highest in the youngest and oldest mothers in 2021, though there are only a small number of births to mothers in these age groups. The percentage of babies with low gestational age and the percentage of babies with low birth weight has remained broadly stable across age groups over the last 10 years.

Also in 2021, a higher percentage of Asian babies had a low birth weight (8.4%) compared to other ethnic groups. The number of low birth weight babies per year in Wales is small when categorised by ethnic group so there can be relatively large changes from year-to-year through natural volatility. However, a larger proportion of Asian babies had low birth weights than any other ethnic group in three out of the four years for which there is data available (starting in 2018).

Breastfeeding has health benefits for babies and their mothers. In the last decade breastfeeding rates at birth have been increasing. The latest annual data in 2021 showed the percentage of babies breastfed at birth was around 64%. This was 3.0 percentage points higher than in 2016. Babies of older mothers are more likely to be breastfed than those of younger mothers.

Image
Line chart showing the percentage of live singleton births with a birth weight of under 2,500g, the rate has typically fluctuated between 5% and 6% over the course of the time series, with a slight upward trend since 2014.

Maternal health

In 2021, the data shows mixed results for healthy lifestyle behaviours of pregnant women at initial assessment, with a lower percentage of women self-reporting as smokers, but a higher percentage recorded as obese than in the previous year.

In 2021, 15% of pregnant women were recorded as smokers at their initial assessment. This accelerates the downward trend since data was first collected in 2016 and is two percentage points lower than in the previous year. However, the large decrease in 2021 may be affected by nearly all data being self-reported, rather than being carbon monoxide monitored.

A greater proportion of younger women were smokers at initial assessment than older women. A third (33%) of women aged 16 to 19 were recorded as smokers at initial assessment compared to one in ten (10%) women aged 30 or over. Smoking rates at initial assessment have fallen over the last five years for all age groups, (other than those aged under 16, which is subject to year-to-year volatility due to the low number of women in this group).

Three out of ten (30%) pregnant women had a body mass index (BMI) of 30 or greater at their initial assessment. The longer-term upward trend continued as the percentage in 2021 was one percentage point higher than in the previous year and three percentage points higher than in 2016 (the first year of comparable data).

Nearly three out of ten (29%) pregnant women reported a mental health condition at their initial assessment. The longer-term upward trend continued, with the latest data two percentage points higher than in the previous year, and ten percentage points higher than in 2016 (the first year of comparable data).

The number of live births increased marginally; the first year that the number has not fallen since 2010. The percentage of new-borns from each ethnic background has remained broadly unchanged since 2018.

The percentage of young mothers continues to fall. Most mothers giving birth in the year were aged between 25 and 34, while there were more mothers aged 40 or older than 19 or younger for the first time on record.

Healthy lifestyle behaviours

The National Survey for Wales has been adapted due to the pandemic, with a change in the mode of the survey (telephone interviews replacing face-to-face interviews) and changes to some questions compared with previous years. Some results from prior to the pandemic are provided to add context to this more recent data. However, as these topics can be sensitive to such changes it is not possible to compare the results directly with data from years prior to 2020-21.

The data presented here is for April 2021 to March 2022.

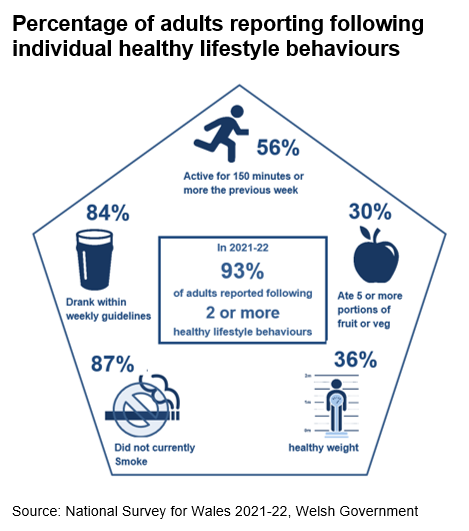
The majority (93%) of adults reported following two or more of the five healthy lifestyle behaviours. This includes:

  1. not currently smoking
  2. drinking within weekly guidelines
  3. eating five or more portions of fruit or vegetables
  4. being active for 150 minutes or more the previous week
  5. being a healthy weight

30% of adults followed four or five of the healthy lifestyle behaviours.

Image
56% active for 150 minutes or more the previous week; 30% ate 5 or more protions of fruit or veg; 36% healthy weight; 87% did not currently smoke; 84% drank within weekly guidelines; 93% of adults reported following 2 or more healthy lifestyle behaviours.

In 2021-22, the percentage of adults with two or more healthy lifestyle behaviours was lower for males (compared with females), people aged between 45 to 65 (compared to those from younger or older age groups) and people from a less deprived area (compared with those from a more deprived area). 

The national milestone on children’s healthy lifestyle behaviours is to increase the percentage of children with two or more healthy behaviours to 94% by 2035 and more than 99% by 2050. 

The School Health Research Network Student Health and Wellbeing survey showed the percentage of 11 to 16 year olds meeting the national milestone remained at 88% in 2019 and has remained stable since data collection started in the 2013/14 academic year. 

These healthy lifestyle behaviours include not smoking, never/rarely drinking alcohol, eating fruit or vegetables every day and being physically active for an hour or more, seven days per week. For these underlying behaviours for 11 to 16 year olds in 2019:

  • 94% reported that they did not smoke
  • 81% reported that they never or rarely drunk alcohol
  • 48% reported that they eat fruit or vegetables every day
  • 18% reported that they had been physically active for an hour or more, seven days per week

In 2019, the percentage of children with two or more healthy lifestyle behaviours declined with age in secondary school and to a lesser degree lower family affluence. However, there were no large differences between girls and boys.

Reported physical activity levels declined with age in secondary school, and boys (rather than girls) and those from a high family affluence background (rather than low family affluence) were more likely to report being physically active for an hour or more every day.

The percentage of children who reported that they eat fruit or vegetables every day also declined with age in secondary school, with girls (rather than boys) and those from a high family affluence background (rather than low family affluence) more likely to report that they eat fruit or vegetables every day. 

The percentage of children who reported that they did not smoke declined with age during secondary school. Girls (compared with boys) and those from a high family affluence background (compared with low family affluence) were more likely to report they did not smoke.

The percentage of children who reported that they never or rarely drank alcohol fell with age during secondary school. There was little difference between boys and girls. However, those from a low family affluence background were more likely to report that they never or rarely drank alcohol (compared with high family affluence). 

Image
Line chart showing the percentage of children who drink are non smokers, active every day, eat fruit and vegetables every day and never or rare drink alcohol, between 2013/14 and 2019/20 academic years.

Mental health and wellbeing in adults

Due to the pandemic, the National Survey has taken place over the phone instead of face-to-face. As a result, the national indicator on mental wellbeing (as measured by the Warwick Edinburgh Mental Well-Being Scale for adults (WEMWBS)) hasn’t been updated as normal.

However, from July 2021 to January 2022, a follow-up online survey was trialled, where a sample of approximately 2,000 respondents completed an additional set of questions after completing the telephone survey.

Results for the period covering part of the pandemic are shown below along with some results from previous years to provide context. However, due to the difference in mode and possible real change due to the pandemic, care should be taken when making direct comparisons.

People were asked about their mental wellbeing and results were scored using WEMWBS. A higher score (58 to 70) suggests high mental wellbeing, while scoring 44 or lower suggests having a low mental wellbeing. Scoring between 45 and 57 suggests the person has medium mental wellbeing.

The overall WEMWBS score from July 2021 to January 2022 was 49. This is lower than in 2018-19, when the average score was 51. 30% of people were found to have low wellbeing, 54% to have medium wellbeing, and 16% to have high wellbeing.

On average younger people have lower wellbeing, with those aged 25 to 44 having a score of 47, compared with a score of 52 for those aged over 75.

People who describe their general health as bad or very bad score 39, a lower score than for people with better general health.

People who say they are lonely also have lower mental wellbeing on average (39) than those who are sometimes lonely (53) or never lonely (49).

These interactions with age and health show the same trend as in 2018-19, but with lower average scores in all categories corresponding to lower wellbeing. This decrease may be explained by the effects of the pandemic but the change in mode should also be considered when comparing the results.

Average life satisfaction had been increasing since 2011-12, with slight reductions in average anxiety levels. However, the year prior to the pandemic saw a slight deterioration in levels of both life satisfaction and anxiety. This trend continued in the most recent data which covers most of the first year of the pandemic, with life satisfaction and anxiety levels deteriorating to levels worse than those seen in 2011-12.

Mental health and wellbeing in children

National indicator data for children aged 10 to 15, collected prior to the pandemic (2019/20 academic year), shows there has been little change in the mean strength and difficulties questionnaire score since the 2013/14 academic year. 

However, as for adults, more recent School Health Research Network Student Health and Wellbeing survey data collected in September – December 2021 indicates a fall in mental wellbeing for 11 to 16 year olds (as measured by the Short Warwick-Edinburgh Mental Wellbeing Scale (SWEMWBS)), compared to prior to the pandemic.

The average SWEMWBS score for 11 to 16 year olds was marginally lower in 2021 (23.0), compared to 2019 (23.7). While seemingly only a small reduction, given the large sample, this is a statistically significant decline in mental wellbeing.

Breakdowns by gender and year group showed those self-identifying as neither a boy nor a girl reported the lowest mental wellbeing, and girls reported lower mental wellbeing than boys. Mental wellbeing scores declined with age.

Trends by ethnicity highlight a smaller relative decline in mental wellbeing between 2019 and 2021 among Black, Asian and Minority Ethnic students compared to White students. 

Breakdown by family affluence showed declines of similar magnitude between 2019 and 2021 among students of lower and higher family affluence, suggesting pre-existing socio-economic inequalities in mental wellbeing had not widened over this period. 

Image
Line charts showing increasing scores for life satisfaction, feeling worthwile, feeling happy and reducing scores for feeling anxious from 2012 to 2019. Before a reversal of that trend in 2020 to 2021 to levels worse than those seen in 2011-12.

Hazardous housing

A range of factors are important to everyone's health. For example employment, air pollution and housing all impact on overall health outcomes.

Housing conditions in Wales have improved over the last 10 years, reducing the potential risk to the health of occupants. Social housing dwellings that are compliant with the Welsh Housing Quality Standard continues to increase, with 99% of dwellings compliant (including acceptable fails).

The most recent Welsh Housing Conditions Survey showed that 82% of dwellings were free from the most serious (category 1) hazards in 2017-18, compared with 71% in 2008. There were improvements in all tenures.

Further reading

Previous Well-being of Wales reports, have included further analysis of problematic social media use.

This report covers a wide range of subjects, and therefore in this report it is only possible to consider high level measures of progress. More in depth analysis of many of these topics are available through the range of statistical releases published by Welsh Government, the Office for National Statistics or other statistical producers.

Data sources

A more equal Wales

The goal for a more equal Wales

Author: Sue Leake

A society that enables people to fulfil their potential no matter what their background or circumstances (including their socio economic background and circumstances).

In 2002 the Welsh Government adopted the Social Model of Disability. This model sets out a different way to view disability. Rather than defining people as disabled by their impairment (i.e. the medical model of disability), people with impairments are considered to be disabled by physical, attitudinal and organisational barriers created by society.

The data reported here are derived from a range of sources reflecting the most reliable, recent data available. Many of these sources use definitions of disability which are informed by the medical model in line with the Equality Act 2010 definition. In the Equality Act a disability means a physical or a mental condition which has a substantial and long-term impact on your ability to do normal day to day activities.

What have we learnt from the data in the last year?

The coronavirus (COVID-19) pandemic had a disproportionate effect on many different population groups, with older people, men and people in ethnic minority groups more at risk of becoming seriously ill with the disease in the early stages whilst the more indirect impact of socio-economic harms are more likely to have been felt by groups that are already disadvantaged. This includes young people, women, disabled people and ethnic minority groups. 

The recent rise in inflation will have particularly affected people on low incomes. The longer term consequences of the pandemic and recent world events’ impact on inflation remain highly uncertain at the time of writing. Whilst It is too soon to assess the full effects of the pandemic on young people, early evidence indicates that they have been disproportionately affected by the socio-economic consequences. There is evidence in particular that the disruptive effects on education have affected particularly young people from disadvantaged backgrounds.

Socio-economic disadvantage 

In 2021-22, 11% of adults were classed as materially deprived (that is, unable to afford certain things such as keeping the house warm enough, making regular savings, or having a holiday once a year). Nearly half (49%) of single parents were in material deprivation in 2021-22 and 2% of households said they had received food from a food bank during 2021-22.

Although general mortality rates are normally higher in more deprived areas, in 2021 the age-standardised mortality rate of deaths registered due to COVID-19 in the most deprived areas in Wales was 74% higher than that in the least deprived areas.

New data on housing affordability shows that for the latest financial years for which data is available (2017-2020) 19.4% of households spend 30% or more of their income on housing costs.

Gender 

Girls continue to achieve better educational outcomes at GCSE. In summer 2021, girls were awarded more grades at A* to C than boys. The largest grade disparity was at the A* and A grade: girls were awarded 6.5 and 4.5 percentage points, respectively, more than boys. The grade disparity at A* widened in 2021.

In April 2021, the (full-time) gender pay gap was 5.0%, unchanged on the previous year and the lowest rate ever recorded.  

Age 

Provisional estimates for 2020, the first covering any period of the pandemic, show an increase in young people’s participation in education and the labour market, driven by increased participation in education or training, though it is too soon to assess the full impact of the pandemic on this trend.

Our satisfaction with life tends to be higher in the older age groups.

A separate sub-report on well-being in children and young people has been published alongside this report. This assesses the experiences of this group in more detail.

Ethnicity

5.0% of the Welsh population described themselves as Black, Asian or another minority ethnic group in 2018 to 2020. The second largest ethnic group (after White) is Asian, at 2.3% of the population.

Children from some ethnic groups continue to achieve better on average in school compared to others, with greater proportions of GCSE entries by Black, Asian and Minority Ethnic pupils awarded A* to A and A* to C grades in summer 2021 than White British pupils.

There was a 16% increase in recorded race hate crimes between 2019-20 and 2020-21, although the proportion of hate crimes with race as a motivation factor did not change.

Religion

Latest estimates (2018 to 2020) show that for the first time in Wales, the proportion of the population stating they had no religion (49.9%) was higher than the proportion identifying as Christian (45.8%). 1.7% of the population identified as Muslim and 2.4% with another religion (other than Christianity). Over two-thirds of the Muslim population live in south east Wales.

Whilst police-recorded hate crimes have generally increased in 2020-21, the number reported to have been motivated by religion reduced by a quarter. 

Sexual orientation 

Latest estimates (2020) show that 4.2% of the Welsh population identify themselves as gay or lesbian, bisexual or another sexuality (other than heterosexual).

There were 397 same-sex marriages in 2019, whilst same-sex civil partnerships have reduced substantially to around 40 a year since 2014.

The latest National Survey for Wales results available (2019-20) indicate that people who are lesbian, gay or bisexual are about twice as likely to report feeling lonely (particularly emotional loneliness) than others. They are also more likely to report having experienced discrimination at work

There were 884 hate crimes recorded by police in which sexual orientation was considered the motivating factor in 2020-21, increasing by 16% from 763 in the previous year, although the proportion of hate crimes with sexual orientation as a motivation factor did not change.

Disability

The employment rate among disabled adults aged 16 to 64 remains lower than among those who are not disabled. 46.7% of disabled adults aged 16 to 64 were employed in the year ending March 2021.

In 2021-22 just under one in five (19%) of people with a limiting long-standing illness or disability lived in a household in material deprivation. This is nearly three times as high as for people who are not disabled (7%).

The disability pay gap in Wales was 11.6% in 2021, up from 9.9% in 2018. This means that disabled people in Wales earned, on average, 11.6% less per hour than non-disabled people. 

Marital status 

It remains true that those who are married are less likely to be in material deprivation than those who are separated or divorced.

In 2020, there were 358 opposite-sex civil partnerships formed in Wales. This is the first year for which civil partnerships between opposite-sex couples have been reported following the change in legislation to extend civil partnerships to opposite-sex couples from 31 December 2019.

What is the longer term progress towards the goal?

Some inequalities are showing little sign of improvement in the last 5 years and some of those people who were already disadvantaged are likely to have been more impacted by the COVID-19 pandemic and, more recently, by the rise in inflation.

The percentage of people living in relative income poverty has been relatively stable in Wales for over 15 years.

Those who are divorced, separated or never married are still more likely to struggle financially, with single parent households most likely to be in material deprivation.

There remains a gap in educational outcomes of children in school eligible for free school meals and those who are not, with evidence that this is widening at the GCSE level. The gap at GCSE level has widened in the last 6 years, with data (up to 2019) indicating that at earlier stages of school the gap widens as pupils get older. 

There is a national milestone to eliminate the pay gap for gender, disability and ethnicity by 2050. The gender pay gap has generally been narrowing, though remained stable in 2021. Latest data also shows that the ethnicity pay gap has decreased. On average, employees from ethnic minority groups earn around 1.4% per hour less than White British employees, although there are large differences among different ethnic minorities. The disability pay gap, which rose between 2014 and 2019 now appears to be reducing, though the employment situation during the COVID-19 pandemic may have had an impact on this trend. 

Life satisfaction scores reduced slightly during 2020-21 but have generally returned to pre-pandemic levels in 2021-22 for all age groups except those aged 16 to 24 years. People aged 16 to 24 are now more likely to report being lonely than those aged 65 and over.

Other than young people, there are some other groups who are more likely to report feeling lonely. These include people with a limiting long-standing disability, people who are lesbian, gay or bisexual and people who are not White British

Children from some ethnic minority groups continue to achieve better on average in school compared to others, with greater proportions of GCSE entries by Black, Asian and minority ethnic pupils awarded A* to A and A* to C grades in summer 2021 than White British pupils.

Race is still judged to be a motivating factor in nearly two-thirds of all recorded hate crime, and there was a rise in recorded race hate crimes in 2020-21.

There is a longer term trend for fewer people to identify their religion as Christian and more people to state they had no religion. These remain the largest categories whilst the proportion of people identifying as Muslim has remained between 1% and 2%, and those identifying with any other religion between 2% and 3%. 

The proportion of people identifying as gay or lesbian, bisexual or another sexuality (other than heterosexual) in Wales has doubled since 2016 (to 4.2%). Since 2014, when same-sex marriages became legal, the number of same-sex marriages has increased (to 397 in 2019) whilst the number of same-sex civil partnerships formed has reduced substantially to around 40 partnerships annually.

Hate crimes recorded by police in which sexual orientation was considered the motivating factor have continued to increase and account for almost one fifth of all recorded hate crimes, though Stonewall Cymru research suggests that many such incidents are not reported to the police.

Employment rates for disabled people were rising but decreased to a rate similar to December 2018 during the year ending March 2021. The employment rate among disabled adults (16 to 64) remains lower than among those who are not disabled. 

Households including someone who is disabled are still more likely to struggle financially. 

In general, educational outcomes for children with special educational needs or additional leaning needs have been improving.

Socio-economic disadvantage

Prior to the COVID-19 pandemic, overall poverty rates had remained relatively stable in Wales for over 15 years and children remained the age group most likely to be in relative income poverty. The recent rise in inflation will have particularly affected people on low incomes.

The Family Resources Survey is the main source for official poverty estimates. The 2020-21 data collection process for this survey was impacted by COVID-19. Because of this, for many breakdowns of estimates of income poverty (including for Wales) it is not possible to make meaningful statistical assessments of trends and changes. Therefore, the poverty and material deprivation statistics for people with different characteristics presented in this chapter relate to data up to 2019-20. 

Between 2017-18 and 2019-20, nearly a quarter of the population (23%) were living in relative income poverty after paying their housing costs.

Children are the population group most likely to be in relative income poverty. The most recent figures show that this was the case for 31% of children in Wales compared to 18% of pensioners.

In 2021-22, 11% of adults were classed as materially deprived (that is, unable to afford certain things such as keeping the house warm enough, making regular savings, or having a holiday once a year). This is the case for a higher percentage of females (13%) relative to males (9%). However, this survey data preceded the current cost-of-living crisis. Single parent households are more likely to be materially deprived than other types of households. Nearly half (49%) of single parents were materially deprived in 2021-22.

A person is considered to be in persistent poverty if they are in relative income poverty in at least 3 out of 4 consecutive years. Data from the Understanding Society survey shows that an individual in Wales had a 12% likelihood of being in persistent poverty between 2016 and 2020 (after housing costs were paid). A child in Wales had a slightly higher likelihood of being in persistent poverty at 13%.

A national indicator on the percentage of households spending 30% or more of income on housing costs was added to the national indicator set in December 2021, based on data from the Family Resources Survey. Across all tenures, for the latest financial years for which data is available (2017 to 2020) 19.4% of households spend 30% or more of their income on housing costs. This percentage has been fairly consistent over the period 2011-12 to 2019-20, but varies by housing tenure. Whilst, in 2017-2020, only 2.7% of households who own their own home outright and 15.4% of those who own a home with a mortgage spend 30% or more of their income on housing costs, percentages are higher for the other two tenures; 37.1% for private rented households, 47.2% of those in social rented housing. The costs of domestic energy use such as gas and electricity are excluded from these housing costs as data on such costs are not collected in the FRS, but latest fuel poverty estimates are provided below.

In 2021-22, 2% of households said they had received food from a food bank due to a lack of money in the last 12 months, with a further 1% saying they hadn’t but had wanted to. An estimated 196,000 households (14% of households) were living in fuel poverty in October 2021, though the effect of the increase in domestic energy price cap in April 2022 is expected to have increased this substantially despite interventions to mitigate the impact.

Healthy life expectancy continues to be worse for those living in more deprived areas. The gap in healthy life expectancy between the most and least deprived areas has remained wide but relatively stable between 2011 to 2013 and 2018 to 2020.

Public Health Wales report that people living in the most deprived communities in Wales were less likely to take up their offer of health screening compared to those living in the least deprived communities across all adult health screening programmes in 2020-21.

COVID-19 mortality rates continued to be higher in the most deprived areas of Wales. In 2021, the age-standardised rate of deaths registered due to COVID-19 was 74% higher in the most deprived areas of Wales than in the least deprived areas.

At GCSE there remains a gap in educational outcomes of children in school eligible for free school meals and those who are not. The gap in entries achieving A* to A grades at GCSE has widened in the last six years, with the gap in entries achieving A* to C grades being relatively stable. Data up to 2019 indicates that at earlier stages of school the gap widens as pupils get older.

In 2020/21, the gap between pupils not eligible for free school meals (FSM) and pupils eligible for FSM awarded GCSE grades A* to A widened to 21.3 percentage points, from 17.8 percentage points in 2019/20. The gap had previously been relatively stable at around 14.7 percentage points between 2015/16 and 2018/19 before widening in the most recent 2 years.

Image
A line chart showing the gap between percentages of students eligible for free school meals and students not eligible for free school meals achieving A*-A, A*-C, and A*-G at GCSE in 2020/21. The gap increased in all three grade ranges between 2019/20 and 2020/21.

In 2020/21 the gap between pupils not eligible for FSM and pupils eligible for FSM awarded grades A* to C widened to 27.3 percentage points, returning to a gap similar in size to the years leading up to the pandemic after a fall to 24.7 percentage points in 2019/20.

Following the cancellation of public examinations in summer 2020 and summer 2021, all grades that would have been awarded following an examination were replaced with the centre assessed or determined grade.

Gender

Girls continue to achieve better educational outcomes at GCSE and are more likely to continue in full time education beyond age 16. The gender pay gap remained unchanged in Wales in 2021, and employment rates remain lower for women than men.

Life expectancy is still longer for women than for men but the proportion of life spent in good health is higher for men. 

Public Health Wales report that, for programmes that invite all genders to participate in health screening, such as bowel cancer screening, there was a difference in  uptake in 2020-21, with men less likely to take up their offer of screening than women (though the gap is small).

In terms of the direct impact of COVID-19, the age-standardised mortality rate of deaths registered due to COVID-19 was 50% higher for males than females in 2021, with an even greater difference observed in the most deprived areas of Wales.

In 2021-22, mental wellbeing (as measured by the Warwick Edinburgh Mental Well-Being Scale for adults) was slightly higher for men than women, with males having a mean score of 49.2 and females having a mean score of 48.7. Suicide rates, however, remain more than three times higher for men than women. Whilst over the long-term suicide rates have fluctuated from year to year but have generally been falling, this decline is far more pronounced in women than men.

Girls continue to achieve better educational outcomes at GCSE. In summer 2021, girls were awarded more grades at A* to C than boys. The largest grade disparity was at the A* and A grade: girls were awarded 6.5 and 4.5 percentage points, respectively, more than boys.

Image
A line chart showing the gap between percentages of girls and boys achieving A*-A, A*-C, and A*-G at GCSE in 2020/21. There was a large increase in the gap at A*-A between 2019/20 and 2020/21, while the gap at A*-C decreased. The gap at A*-G remains small.

A higher proportion of females aged 16 to 18 than males remain in full-time education. This is also the case for those aged 19 to 24 years old.

In terms of the whole population, females are more likely to hold qualifications at or above level 4, whilst there are higher proportions of males than females with no qualifications in nearly all age groups.

Employment rates in Wales are lower for women than for men, at 69.7% for women and 76.5% for men in 2021. Economic inactivity rates (excluding students) are higher for women (24.1%) than men over this period (15.7). Evidence from the UK as a whole indicates that the greater scope for home working may have encouraged more women to participate in the labour market.

Image
Line chart showing employment rates for those aged between 16 and 64 by sex between 2005 and 2021. The employment rate for males dropped 3 percentage points to 74% in 2021, while the employment rate for females remained stable at 70%.

The gender pay gap, based on median hourly full-time earnings (excluding overtime), stood at 5.0% in 2021, unchanged on the previous year and the lowest rate ever recorded. However, for part-time employees in Wales, women were paid the same as men on average, a decrease of 0.8 percentage points from the previous year (when women were paid more than men). For all employees, the gender pay gap remains considerably higher at 12.3% in 2021. This is higher than for each of full-time employees and part-time employees, because women fill more part-time jobs, which in comparison with full-time jobs have lower hourly median pay. Of the 11 UK countries and regions where men earn more than women (full-time employees), Wales has the second smallest pay gap.

Women are less likely to say they feel safe in their community, despite the latest data (from 2019-20) showing men being somewhat more likely to be victims of violent crime than women. During 2021-22, 51% of women said they felt safe in their community compared to 81% of men. In addition to this, women are around 4 times more likely to feel very unsafe while walking alone in their local area after dark than men (13% of women reported this compared to 3% of men).

In 2020-21, 56% of new public appointments and 46% of public re-appointments made by the Welsh Government were to females (where the gender of the appointee is known), the former being a 12 percentage point increase since 2019-20. This includes chairs and members regulated by the Public Appointments Commissioner. However, due to pandemic disruption, many competitions were suspended and as such any conclusions drawn from this year’s data need to be tentative and viewed with caution.

Age

Our satisfaction with life tends to be higher in the older age groups. Relative income poverty is higher in the working population than in pensioner households.

Initial results from the 2021 Census reveal the trend in population ageing has continued, with more people than ever before in older age groups in Wales. The proportion of the population who were aged 65 years or older in March 2021 was 21.3% (up from 18.4% in 2011). The size of the population aged 90 years or older in Wales (29,700, 1.0%) has increased since 2011, when 25,200 (0.8%) were 90 years or older.

Subjective wellbeing tends to be higher in the older age groups. In 2021-22 the highest average life satisfaction scores are for the 65 to 74 age group (8.0) and for the 75 and over group (7.9), and the lowest are for those aged 16 to 24 and 45 to 64 (7.6). Whilst life satisfaction for people aged 16 to 24 years was lower in 2021-22 compared with prior to the pandemic (2019-20), the pattern for other age groups has returned to pre-pandemic life satisfaction scores following a dip for each age group during 2020-21.

Image
A bar graph showing mean life satisfaction by age group. Working age groups (16-24, 25-44, 45-64) have lower mean satisfaction scores than those aged 65+.

Public Health Wales report that, whilst many health screening programmes invite people from specific age ranges, people in younger age groups within the cohort invited were less likely to take up their offer of health screening compared to those in older age groups in 2020-21.

In recent years a higher proportion of the working-age population has been in relative poverty than pensioner households. 

The employment rate is highest in the 25 to 49 age group whilst the employment rate for those aged 65 and over, which previously saw an increase, has been decreasing since 2019. It is too soon to assess the longer term effects of the pandemic on young people, though early evidence indicates that they have been disproportionately affected by the socio-economic consequences. There is evidence in particular, that the disruptive effects on education have affected particularly young people from disadvantaged backgrounds. Depending on the effectiveness of mitigations in place, the adverse effects could play out in the labour market over coming years or even decades.

A new national milestone on participation in education and the labour market by 16 to 24 year olds was set in 2021. Provisional estimates for 2020, show an increase in young people’s participation in education and the labour market, driven by increased participation in education or training. It is too soon, however, to assess the longer term impact of the pandemic on this trend.

Younger age groups are generally at higher risk of being victims of crime (including violent crime), with the 16 to 24 year age group experiencing the highest rates in most crime categories and people aged over 75 years experiencing the lowest rates of crime in Wales during the 12 months up to March 2020. 

In 2020-21, 71% of new public appointments and re-appointments made by the Welsh Government were to individuals aged 55 or over (where the age of the appointee is known). This is a significant rise from 56% in 2019-20. However, due to pandemic disruption, many competitions were suspended and as such any conclusions drawn from this year’s data need to be tentative and viewed with caution. 

Older people (aged 65 and over) are more likely to have a strong sense of community compared with younger age groups, whilst 91% of those aged 65 and over are satisfied with their local area as a place to live. 

Ethnicity

Children from some ethnic groups (for example, Asian and children with a mixed ethnic background) tend to achieve better on average in school compared to others. However, employment rates and average pay remain lower for Black, Asian and minority ethnic groups and people in these groups are more likely to be in relative income poverty.

95.0% of the population described their ethnic group as White in 2018 to 2020, varying by region from 97.5% of the population in north Wales to 93.2% in south east Wales. 

5.0% of the Welsh population describe themselves as Black, Asian or Minority Ethnic group. The second largest ethnic group (after White) in 2018 to 2020 is Asian, at 2.3% of the population.

In the 2021 Senedd Cymru elections, three members from an ethnic minority background were elected (5% of all members elected).

GCSE results for 2020/21 show that 35.6% of Black, Asian and Minority Ethnic pupils achieved A* to A grades compared to 28.9% of White pupils. This gap has been widening since 2015/16 (4.5 percentage points in 2015/16 to 6.7 percentage points in 2020/21). The gap in pupils achieving A* to C grades has also widened (from 0.9 in 2015/16 percentage points to 3.3 percentage points in 2020/21).

Image
A line chart showing the gap between percentages of Black, Asian and Minority Ethnic students and White students achieving A*-A, A*-C, and A*-G at GCSE in 2020/21. The gap increased in all three grade ranges between 2019/20 and 2020/21. The difference at A*-G remains very small.

At A level, the grade distribution shifted upwards again in 2020/21, but this was not the case for all broad ethnic groups. The proportion of A2 (second year of A level) learners with Black, African, Caribbean, Black British backgrounds who got at least 3 Cs fell steeply, undoing much of the rise in grades in 2019/20. In 2020/21, only 54% of learners with these backgrounds achieved at least three Cs compared to 72% in 2019/20. This was the group with the lowest percentage of A* to Cs at A2 in 2020/21, while the highest percentage of A* to Cs was seen amongst the Asian or Asian British (74%) and White (73%) groups.

The School Workforce Census reported that the proportion of school teachers who were from a Black, Asian or Minority Ethnic (excluding White ethnic minorities) group was 1.1% in November 2021, significantly lower than the 9.1% of pupils aged 5 or over in Wales who are from a Black, Asian and Minority Ethnic (excluding White ethnic minorities) group in the February 2022 Schools’ Census.

9% of Welsh student enrolments at higher education institutions in Wales in 2020/21 were stated to be from an ethnic minority group.

Between August 2017 and July 2021, year 11 students with Gypsy, Traveller or Irish Traveller backgrounds were less likely to continue onto post-16 learning than other ethnic groups. For most other ethnic minority groups participation in post-16 learning was close to, or above, the Wales average.

Work-based learning is less ethnically diverse than other areas of post-16 learning. Learners with Black, Asian, or other ethnic minority backgrounds were generally less likely to be in sustained employment after leaving post-16 learning. 

Employment rates (year ending March 2021) among the Welsh population aged 16 to 64 are highest among individuals from a White ethnic background and for those in the ‘other ethnicity group’ category (both 73%), with employment rates lowest amongst individuals with a Black ethnicity (57%). The equivalent rates among individuals from an Asian background and people with a mixed ethnic background are 65% and 64%, respectively.

Employment rates for ethnic groups differ for males and females, with the biggest gap in employment rates seen in the Asian ethnic group (males 79% compared to females 54%).

The pay gap between White employees and Black, Asian and Minority Ethnic employees in 2019 had narrowed to its smallest level since 2012 in England and Wales. The ethnicity pay gap differs across region and in 2019 was largest in London (23.8%) and smallest in Wales (1.4%), though there is some volatility in the ethnicity pay gap for Wales. Evidence from across England and Wales shows that most of the ethnic minority groups analysed continue to earn less than White British employees but, in 2019, those in the Chinese, White Irish, White and Asian, and Indian ethnic groups all earned higher hourly pay on average than White British employees.

Being part of an ethnic minority group is linked with a greater likelihood of relative income poverty. For the period 2015-16 to 2019-20 there was a 29% likelihood of people whose head of household comes from an ethnic minority group to be living in relative income poverty. This compares to a 24% likelihood for those whose head of household comes from a White ethnic group. 

In 2020-21, less than 5% of public appointments and re-appointments made by the Welsh Government were to individuals from a Black, Asian or Minority Ethnic background (where the ethnicity of the appointee is known), compared to 9% in 2019-20. However, due to pandemic disruption, many competitions were suspended and as such any conclusions drawn from this year’s data need to be tentative and viewed with caution.

There is little reported significant difference in the way different ethnic minorities feel about their local area, sense of community, and likelihood of saying that people in the area treat each other with respect. However, people who are not White British are more likely to report being lonely (25% compared to 12% of those who are White British in 2021-22) 

Research published by the Wales Centre for Public Policy in March 2021 highlights that in Wales, Black, Asian and Minority Ethnic people are over-represented at every stage of the criminal justice system, for instance, as victims of crime, in stop and searches and in the prison population.

Race was judged to be a motivating factor in two-thirds of all hate crimes recorded in Wales in 2020-21, a similar proportion to that in 2019-20. However, numbers of police-recorded race hate crimes increased by 16% in 2020-21 compared with 2019-20.

Image
A line chart showing the number of hate crime offences reported in wales between 2012-13 and 2020-21 by motivating factor. reported hate crimes increased for all motivations except Religion in 2020-21 compared to 2019-20. Race remains the primary motivating factor, accounting for arround two thirds of reported crimes.

Note that data from the Crime Survey for England and Wales for 2018-2020 suggests that only around half of all hate crime incidents come to the attention of the police in England and Wales.

Religion

For the first time in Wales (2018 to 2020), the proportion of the population stating they had no religion (49.9%) was higher than the proportion identifying as Christian (45.8%), though these figures varied by region with north Wales continuing to have a higher percentage of the population identifying as Christian than those who stated they had no religion.

1.7% of the population identified as Muslim and 2.4% identified with another religion (apart from Christian).

Of the Muslim population in Wales, a large proportion (71.8%) lived in south east Wales.

A higher proportion of women than men identified as having a religion (54.6% compared with 45.5%) and the proportion of people identifying as having a religion generally increased by age group. The Muslim population has a younger age profile than most other religions in Wales.

Those who identify as Christian tend to report a stronger sense of community, particularly in relation to feeling like they belong to an area and feeling that people in the area treat each other with respect. They also are more likely to report that they are satisfied with their local area. These results could be impacted by the age profiles of different groups, with those identifying as Christian tending to have an older age profile.

Religion was judged to be a motivating factor in 3% of hate crimes recorded in Wales in 2020-21, down from 5% in 2019-20. A total of 150 religious based hate crimes were recorded by police in Wales in 2020-21, 49 fewer than in 2019-20. 

Employment rates for those who identify as Christian or with no religion were similar in the year ending March 2021. Amongst Muslims the employment rate for females (38%) was around half of that for males (78%).

Sexual orientation

The numbers who identify as lesbian, gay or bisexual, or who chose not to identify as straight (heterosexual) are rising, with same-sex marriages now much more common than same-sex civil partnerships.

In 2020, 94.3% of the population of Wales identified as heterosexual, with 4.2% identifying as gay or lesbian, bisexual or another sexuality. The proportion of people identifying as gay or lesbian, bisexual or another sexuality (other than heterosexual) in Wales has doubled since 2016.

Since 2014, when same-sex marriages became legal, the number of same-sex marriages has increased (to 397 in 2019) whilst the number of same-sex civil partnerships formed has reduced substantially (40 partnerships in 2020). Two thirds of same-sex marriages in 2019 were between female couples. Every year since the introduction of same-sex marriages in 2014, there have been more female than male same-sex marriages.

In 2019-20 a lower proportion of adults who identified as heterosexual were in material deprivation (12%) compared with those who did not identify as heterosexual (22%). 

The latest National Survey for Wales results available (2019-20) indicate that people who are lesbian, gay or bisexual are about twice as likely to report feeling lonely (particularly emotional loneliness) than others. They are also more likely to report having experienced discrimination at work. 

Sexual orientation was judged to be a motivating factor in 884 hate crimes recorded by police in Wales in 2020-21, up 16% from 763 in 2019-20. This represents 19% of all recorded hate crimes, the same proportion as in the previous year. 

Stonewall Cymru research within the LGBT community in 2017 indicates that almost one in four LGBT people (23%) say they have experienced a hate crime or incident due to their sexual orientation and/or gender identity in the last 12 months and that many of them did not report the incident to the police. There is also evidence from the Crime Survey for England and Wales (2017-18 to 2019-20) that only around half of hate crime incidents come to the attention of the police.

Gender reassignment

The first data from the 2021 Census on gender identity will be published later in 2022. As a result, next year’s Wellbeing of Wales report will provide more comprehensive analysis on this topic.

The School Health Research Network’s Student Health and Wellbeing survey collects data on mental wellbeing for 11-16 year olds, as measured by the Short Warwick-Edinburgh Mental Wellbeing Scale. Breakdowns by gender and year group showed those self-identifying as neither a boy nor a girl reported the lowest mental wellbeing, and girls reported lower mental wellbeing than boys.

Transgender identity was judged to be a motivating factor in 173 hate crimes in Wales over this period, equivalent to 4% of all hate crime recorded in Wales. This is an increase of 31% (41 more recorded crimes) compared with 2019-20.

Disability

Whilst over time employment rates for disabled people have been rising a disability pay gap remains and households including someone who is disabled are still more likely to struggle financially.

In 2018 to 2020 just over a fifth of the working-age population (aged 16 to 64, 22.1%) identified as disabled. This proportion has been gradually increasing since 2013 to 2015 (14.0%) and varies by age (from 15.4% in the 16 to 24 age group to 28.3% in the 45 to 64 age group). A higher proportion of women than men of this age group identified as disabled (24.6% compared with 19.6%). 

North Wales had the lowest proportion of people identifying as disabled (20.1%) in these age groups, while south east Wales, and mid and south west Wales had similar proportions (22.6% and 23.0% respectively).

National Survey for Wales data (2021-22) shows that life satisfaction was generally lower for people aged 16+ with a limiting long-standing illness or disability (their mean score was 7.0) than for those without (8.0).

National Survey for Wales data (2021-22) also indicates that disabled adults or those with a limiting long-standing illness are much more likely to say they feel lonely most or all of the time (22%) compared with those without such illnesses or disabilities (8%). They also are more likely to report not feeling safe in the local area after dark and less likely to feel a strong sense of community.

The educational outcomes of pupils with special educational needs or additional learning needs have generally improved in recent years. In 2020/21, 96% of GCSE entries by pupils in year 11 with a special educational need were awarded a grade at A* to G, down from 98% in 2019/20. 

Image
A line chart showing the percentage of students with a statement of special educational need achieving A*-G at GCSE in 2020/21. After a steep increase in 2019/20, the percentage has decreased slightly in 2020/21.

Of the working-age population, disabled people (15%) are more likely to have no qualifications than non-disabled people (6%) and are less likely to hold qualifications above level 2.

In the latest period (2017-18 to 2019-20), 38% of children who lived in a household where there was someone who was disabled were in relative income poverty compared with 26% in households where no-one was disabled. Similarly, 31% of working-age adults who lived in a household where there was someone who was disabled were in relative income poverty compared with 18% of those who lived in a household where no-one was disabled. 

In 2021-22, disabled people or people with a limiting long-standing illness were almost three times as likely to live in a household in material deprivation than those who are not disabled. Around one in five disabled people (19%)  or people with a limiting long-standing illness lived in a household in material deprivation compared with 7% of people who were not disabled.

For the year ending 31 March 2021 the employment rate among disabled people aged 16-64 in Wales was 46.7% whilst the rate for people who are not disabled was 79.6%. The disability employment gap for 2021, of 32.9 percentage points, is reduced compared to 5 years ago when it was 35.5 percentage points.  

The disability pay gap in Wales was 11.6% in 2021. This means that disabled people in Wales earned, on average, 11.6% less per hour than non-disabled people. While this is down from the peak of 15.1% in 2019, it is still higher than between 2016 and 2018. The pay gap in Wales was the smallest of the four UK nations. The pay gap for the UK as a whole was 13.8%.

Image
A bar graph showing the disability employment rate gap for the years ending 31 March 2016 to 2021. Following a decrease between 2018 and 2019, the gap has remained broadly stable.

In 2020-21, less than 5% of public appointments and re-appointments made by the Welsh Government were to individuals who declared a disability. Due to pandemic disruption, many competitions were suspended and as such any conclusions drawn from this year’s data need to be tentative and viewed with caution.

Disability was judged to be a motivating factor in 11% of hate crimes recorded in Wales in 2020-21, the same proportion as in 2019-20. The Crime Survey for England and Wales found that in the year ending March 2020, 17.5% of disabled people aged 16 to 59 in Wales experienced domestic abuse, compared to 6% of non-disabled people.

Marital status

Being married is associated with higher satisfaction with life and a lower likelihood of being materially deprived. Single parent households continue to face challenges, being more likely to be materially deprived than other types of households. 

There were 11,699 marriages formed in Wales in 2019, down from 2018 (12,840), with the majority of marriages involving opposite sex couples (96.6%). In 2019, there were 397 marriages between same-sex couples in Wales, with 67% (265) of these between female couples. No figures are yet available to reflect the impact of the COVID-19 pandemic on the number of marriages taking place in 2020 and 2021.

In 2020, there were 358 opposite-sex civil partnerships formed in Wales. This is the first year for which civil partnerships between opposite-sex couples have been reported following the change in legislation to extend civil partnerships to opposite-sex couples from 31 December 2019.

In 2020, 40 same-sex civil partnerships formed in Wales. This represents a big drop from the 265 same-sex civil partnerships recorded in 2013. This reflects the fact that following the introduction of the Marriage (Same Sex Couples) Act 2013, same-sex marriages became legal from 29 March 2014.

In 2021-22, 18% of divorced adults and 24% of adults who are separated (but still legally married) were in material deprivation compared with 7% of adults who were married and 7% who were widowed. Nearly half (49%) of single parents were materially deprived.

National Survey for Wales results for 2021-22 confirmed that a higher proportion of the married population report a high satisfaction with life, feeling that the things they do in life are worthwhile and high levels of happiness compared to adults that have never married, the separated, divorced, or widowed. In general, reported life satisfaction during the height of the COVID-19 pandemic (in 2020-21) was lower than in 2019-20 but it has returned to the pre-pandemic levels in 2021-22. 

In 2021-22, people who were married were least likely to report being lonely (8%), while people who were separated but legally married were the most likely (23%). People who were single (that is, had never been married or registered in a civil partnership), divorced, or widowed were also more likely to report loneliness than people who were married (16%, 19% and 16% respectively). Single parent households and single pensioner households were the households least likely to say they feel safe in their communities after dark in 2021-22.

Image
A bar graph showing mean life satisfaction score by marital status in 2021-22. Those who are married or in a civil partnership have the highest mean score (8.0) while those who are seperated but still legally married have the lowest (6.9). Those who are single, divorced or widowed have very similar life satisfaction scores.

Relationship breakdown can lead to consequences in relation to housing with data captured prior the pandemic (2018-19) showing that relationship breakdown is one of the key causes cited for households being threatened with homelessness. Of those judged to be homeless and in priority need, just over half are single person households and a third are lone parents with dependent children.

Of those aged between 16 and 64, people who were married or in a civil partnership had the highest employment rates (80%) in 2020-21 compared to people who were separated or divorced (72%), single (65%) or widowed (52%). Employment rates are generally lower for women than for men and this is particularly the case for women who are married or in a civil partnership. The employment rate in 2020-21 for married men is 86% compared to 75% for married women .

Further reading

Data sources

Equality and diversity statistics (populations)

National Survey for Wales, on life satisfaction, sense of community, feeling of safety, material deprivation

Population and household estimates for Wales (Census 2021)

Health and wellbeing

Youth mental health and wellbeing in Wales: Comparing findings from the 2019 and 2021 School Health Research Network Student Health and Wellbeing survey (Student Health Research Network)

Screening Division Inequities Report 2020-21 (Public Health Wales)

Poverty

Relative income poverty

National Survey for Wales (material deprivation) (StatsWales)

Fuel poverty

Mortality

Health state life expectancies (Office for National Statistics)

Deaths due to COVID-19, registered in England and Wales (Office for National Statistics)

Suicides in England and Wales (Office for National Statistics)

Education

Exam results

Participation of young people in education and the labour market

Schools' census results

Post-16 learning statistics by learners' ethnic group

Outcomes for learners in post-16 education affected by the coronavirus (COVID-19) pandemic

Welsh Government analysis of Higher Education Statistics Agency (HESA) data.

Level of highest qualification held by working age adults

Labour market

Labour market statistics (Annual Population Survey)

Participation in the Labour Market (StatsWales)

Pay gaps

Gender Pay Gap (Annual Survey of Hours and Earnings, StatsWales)

Ethnicity pay gap (Office for National Statistics)

Disability pay gap (Office for National Statistics)

Public appointments

The Commissioner for Public Appointments annual reports

Disability

Outcomes for disabled people in the UK (Office for National Statistics)

Marriages and Civil Partnerships

Marriages in England and Wales (Office for National Statistics)

Crime and justice

Hate Crime, England and Wales (Home Office)

Hate Crime reporting rates (Crime Survey for England and Wales)

Police Recorded Crime Open data tables (Home Office)

Prevalence of Crime (Office for National Statistics)

Improving Race Equality in Crime and Justice Policy (Wales Centre for Public Policy)

2021 Senedd elections

Election 2021: How diverse is the Sixth Senedd (Senedd Research)

Homelessness

Homelessness statistics

A Wales of cohesive communities

The goal for a Wales of cohesive communities

Author: Dr Steven Marshall

A Wales of cohesive communities: Attractive, viable, safe and well-connected communities.

What have we learnt from the data in the last year?

The coronavirus (COVID-19) pandemic has had widespread effects on the lives of people in Wales as elsewhere which has affected the indicators in the chapter in different ways. Some have shown improvement while others saw a decline, or, in some cases, a partial return to previous levels in the second year of data during the pandemic. It will not be clear until future years if these changes are short term changes or a sustained change.

The measure relating to community cohesion (people agreeing that they feel they belong in their area, that people get along well and treat each other with respect) has increased since 2018-19, from 52% to 64% in 2021-22,. The proportion of people feeling safe in different situations is 66%, down from 71% in 2018-19.

There has been an increase in people feeling that they can influence decisions in their local area (30%) which continues to reverse the downward trend seen prior to the pandemic.

89% of people say they are satisfied with their local area as a place to live. There were increases in the percentage of people satisfied that good services and facilities are available in their local area (74%) and with their ability to access facilities and services (86%).

During 2021-22 there was an increase in the number of households that had approached their local authority for support as they were threatened with homelessness although this was still lower than in 2019-20. During the COVID-19 pandemic many households who were previously homeless have been supported into emergency temporary accommodation with the aim to move them into more suitable long-term accommodation.

What is the longer term progress towards the goal?

Many of the indicators for cohesive communities are still relatively recent measures collected in the National Survey for Wales and it is therefore difficult to comment confidently on changes over time. The effects of the COVID-19 pandemic, as well as changes in the way the National Survey is collected, also affect comparability with earlier data.

Most of the indicators within this goal have had detailed analysis carried out to determine the factors that are linked with differences in the level of the indicator.

The indicators in this chapter are most commonly associated with age and disability or health in terms of equality dimensions. Where there is an association, being older or in good health are linked with more positive values of the indicator. Long term progress is therefore linked with improvements in health and deprivation or poverty.

All of the indicators are associated with at least one measure to do with socio-economic status or deprivation. The actual measures differ across the indicators but in each case being better off is associated with more positive values of the indicator. The one exception is that being economically inactive is linked with volunteering more, but this is mainly due to the fact that retired people are more likely to volunteer.

There are connections between the different measures of cohesive communities, particularly in the case of loneliness which has a statistically significant link with four other measures. The associations can easily work in either direction, for example, lonely people may be less likely to volunteer but also volunteering may help to reduce loneliness.

People feel that crime has increased a lot in recent years, although the picture from recorded crime is more mixed. During the COVID-19 pandemic there has been a decrease in most types of crimes including violent crimes recorded but fraud and computer misuse offences have been rising.

It is not yet clear if there are any sustained behaviour changes as a result of the pandemic that may impact on the long term progress towards the goal.

Community cohesion

Nearly two-thirds of adults agreed with all three measures of community cohesion – belonging to the local area, people from different backgrounds getting on well together, and treating each other with respect and consideration. This is an increase on pre-pandemic years and a slight drop since last year (2020-21).

In 2021-22, 64% of people agreed with all three statements about their local area that make up the national indicator, while 95% agreed with at least one statement.

These figures have been broadly stable since they were first collected in 2012 until the sizeable increase in 2020-21. Whether the increases in 2020-21 and 2021-22 are a short-term effect of the pandemic (with communities coming together locally) and whether they will be sustained or partly sustained will not become clear until data is available for a number of future years.

There is no statistical difference between men and women on either the individual measures or agreeing with all three statements.

There is a clear trend towards increased community cohesion as deprivation in the area falls.

Image
Bar chart showing percentage of people who agree with three statements about their local area. Results are for three years. 2021-22, 2020-21 and 2018-19. A higher proportion agree with the statements in the last two years compared with 2018-19.

Feeling safe after dark

Two-thirds of adults feel safe in various situations after dark.

The national indicator is the percentage of people that agreed with four statements about feeling safe after dark: at home, walking in their local area, travelling by public transport or travelling by car. In 2021-22, 66% of people felt safe in all four situations.  These results have remained relatively constant across the years since first asked in 2016-17.

Men feel safer (81%) than women (51%). There is a clear trend towards an increased feeling of safety as deprivation in the area falls, with 72% of people who live in the least deprived areas feel safe in all situations compared with 54% of people who live in the most deprived areas.

Image
A bar chart showing the percentage of people agreeing with statements about feeling safe after dark in 2021-22. 96 per cent felt safe at home, 97 per cent felt safe travelling by car, 75 per cent felt safe walking in the local area and 76 per cent felt safe travelling by public transport.

Satisfaction with local area

Overall, according to the 2021-22 National Survey, 89% of people say they are satisfied with their local area as a place to live, slightly higher than the results in 2020-21, 2018-19 and 2016 17.

86% of people were satisfied that they were able to get to or access the services they need, slightly down on 2020-21 but an increase since 2018 19 (83%). The latest slight fall was not statistically significant.

Fewer than 60% of people (in 2021-22) said that municipal services such as community centres, secondary schools, libraries and youth or sports clubs were available in their local area. In contrast, over 80% said public -transport links, shops and pubs were all within a 15 to 20 minute walk from their home.

Image
Bar chart showing percentage of people who are satisfied with their access to services and facilities. 87 per cent of people in urban areas are satisfied compared with 77% of people who live in hamlets and isolated dwellings.

Influencing local decisions

More people now feel they can influence local decisions.

In 2021-22, 30% of people felt that they could influence decisions affecting their local area compared with 26% in 2020-21 and 19% in 2018-19. This is a marked increase since before 2020 and may reflect real change as a direct result of the pandemic, but it requires monitoring in future survey years.

Image
Bar chart showing the percentage of people who feel they can influence decisions affecting their local area. In 2021-22, 30 per cent reported they felt they could influence decisions, this compares with 19 per cent in 2018-19. The 2021-22 result is higher than in all years since first asked in 2012-13.

Volunteering

Results from online data collected as part of the National Survey 2021-22  show that 29% of people say they volunteer for clubs or organisations. This compares with 26% in 2019-20 when the survey took place face-to-face. In all years people most commonly volunteered for charities and sports clubs.

Social interaction has been shown to be beneficial to personal wellbeing and volunteering is an aspect of social interaction that has proven positive benefits in terms of both health and wellbeing.

Image
Bar chart showing the percentage of people volunteering, by type of organisation, in 2021-22. People are most likely to volunteer for charitable organisations (10 per cent), or sports clubs (8 per cent).

Loneliness

Younger people are the most likely to feel lonely, although during the pandemic adults aged 45 to 64 felt more lonely than in previous years. Those aged 65 and over still felt the least lonely.

The National Survey collected data using the De Jong Gierveld loneliness scale which covers both emotional and social loneliness.

In 2021-22, based on all six measures, 13% of people in Wales were found to be lonely, the same as in 2020-21 and lower than in 2019-20. However, there are some marked variations in the percentage of people who say they feel lonely in each of the individual measures. In 2019-20, 36% of people said they missed having people around them compared with 53% in 2021-22 (down from a peak of 71% in 2020-21). In 2020 21 there were increases in the proportion of people who said they had enough people they felt close to, as well as in the proportion having enough people they could rely on. These increases were maintained in 2021-22 at 85% and 78% respectively, compared with 75% and 69% in 2019-20 (Chart 5.6).

Other sources such as the ONS Opinions and Lifestyle Survey found an increase in some aspects of loneliness during the pandemic.

Image
Bar chart showing the results for 2019-20, 2020-21 and 2021-22 and the six questions asked to create the measure of loneliness.. The responses to all but one statement show that people were less lonely in 2021-22 compared with 2019-20.

Digital exclusion

A new national indicator was set in 2021 which will measure the status of digital inclusion. The definition for this indicator will be informed by the result of a research project on a minimum digital living standard commissioned by Welsh Government and undertaken by the University of Liverpool.

In the meantime, results from the National Survey in 2021-22 show that 93% of adults personally use the internet at home, work or elsewhere. The survey currently also asks questions about digital activity and the skills people have. These are grouped into 5 types of skill:

  1. handling information and content
  2. communicating
  3. transacting
  4. problem solving
  5. being safe and legal online

In 2021-22, 78% of internet users had performed activities that related to all 5 of these skills compared with 73% in 2019-20.

Homelessness

Whilst the homelessness prevention rate remained steady in 2021-22, services for those facing homelessness were transformed during the pandemic with an emergency response supporting many households into emergency temporary accommodation. Whilst the ‘no-one left out’ approach has been in place continuously since March 2020 the focus is now on moving from a position of reliance on temporary accommodation, to a system focused on prevention and rapid rehousing.

During 2021-22, 9,228 households in Wales were assessed as being threatened with homelessness, an increase of 27% over 2020-21 but 8% below the level in 2019-20.

Homelessness was successfully prevented for at least 6 months in 67% of these cases. Since 2017-18, homelessness has been successfully prevented in around two-thirds of cases.

In October 2019 there were 405 people estimated to be sleeping rough across Wales, up 17% (58 persons) on the previous year. In 2019, there were estimated to be 33 deaths amongst homeless people in Wales, compared with 34 in 2018 and 13 in 2017.

Management information captured since March 2020 indicate that from the start of the COVID-19 pandemic to the end of June 2022, over 24,200 people who were previously homeless have been supported into emergency temporary accommodation, with the aim to move them into more suitable long-term accommodation. Local authorities’ monthly estimates of the number of people sleeping rough across Wales fluctuates throughout the year but overall have remained below 135 since November 2020.

Crime

A new national indicator was set in 2021 which will measure the percentage of people who have confidence in the justice system. Data is not yet collected for this indicator, but is expected to be first available in 2024-25.

Most people don’t experience crime. In the last year police recorded crime has increased whilst the proportion of the adult population who are victims of crime has remained relatively stable.

Data from the Crime Survey for England and Wales (excluding fraud) in 2021-22 shows 10% of adults were victims of crime and 1.8% were victims of personal crime, similar to levels in 2020-21.

Police recorded crime increased in 2021-221 by 17%, following the 11% decrease in 2020-21. There were increases in most offence categories including violent crime. The exceptions were drug offences and possession of weapons offences which decreased compared to 2020-21. It is likely that the COVID-19 pandemic and the restrictions introduced as public health measures in March 2020 have had an impact on the incidence of many types of crime.

Reported fraud and computer misuse offences have fallen by 13% in Wales between 2020-21 and 2021-22 to a rate of 5 offences per 1,000 population in Wales.

Latest data on perceptions of crime from the Crime Survey for England and Wales (CSEW) in 2019-20 shows 53% of people in Wales believe crime has risen a lot nationally in recent years similar to previous years. The percentages of those believing crime in their local area has risen a lot are much smaller (15%). The latest data on violent crime in Wales from the CSEW shows incidence of violent crime in Wales fell to a rate of 18 per 1,000 adults in 2019-20.

Image
Chart 5.7: Police recorded crime per 1,000 population, 2002-03 to 2020-21

Further reading

Data sources

A Wales of vibrant culture and thriving Welsh language

The goal for a Wales of vibrant culture and thriving Welsh language

Author: Stephanie Howarth

A society that promotes and protects culture, heritage and the Welsh language, and which encourages people to participate in the arts, sports and recreation.

What have we learnt from the data in the last year?

The pandemic has continued to have a negative impact on attendance at arts and cultural events. In 2021-22, 33% of people visited an arts event in the previous year, down substantially from 73% in 2018-19. Arts participation also fell from 20% to 14%. There is no new data on children’s attendance or participation in the arts this year.

There has been mixed progress in sport participation. The rate of adults regularly taking part in sport increased for the first time since 2017-18, although this was not a statistically significant change. However the share who do not take part in any sport or physical activity also increased.

There is no new data on sports participation amongst school pupils, although the latest School Sport Survey is expected to be published later this year.

Both the Annual Population Survey and the National Survey for Wales both showed an increase in the percentage of people who speak Welsh in the latest year. The National Survey for Wales shows that 11% of Welsh speakers are fluent.

The conditions of 444 monuments were assessed in 2021-22. 50% were found to be stable or improved and 50% worsened in condition. 16% of monuments were considered to be at risk. Generally, monuments assessed this year were more likely to be in a worsening condition or at risk than those assessed to date.

The number of museums meeting accredited standards has increased by 5 to 99 and the number of accredited archive services is 14.

What is the longer term progress towards the goal?

Surveys suggest there has been positive progress over the long term in the number of Welsh speakers (especially non-fluent speakers) and in indicators on arts participation and attendance for children. Sports participation for both adults and children has also improved over the longer term, but wide disparities between some groups remain. There has been a decline in some arts-related indicators for adults, with the pandemic exacerbating this further.

The national indicator on arts, culture and heritage has only been collected twice and it shows a fall in regular attendance and participation, from 75% in 2017-18 to 71% in 2019-20. Looking at arts specifically, the fall in attendance and participation worsened during the pandemic, but this not yet an established trend. There continue to be wide differences depending on age, health, deprivation and qualifications.

Despite the decrease in attendance for the most recent year (2019), children and young people’s attendance and participation in the arts has increased substantially over the last decade. 

More museums and archive services are meeting accredited standards. 63% have now reached this benchmark, up from 59% in 2017.

Since 2016-17, there has been positive progress in regular participation in sport by adults, despite a plateau between 2017-18 and 2019-20. Sports participation amongst school pupils has stayed at the same level in 2015 and 2018 following an increase from the previous survey.

The number and percentage of people who speak Welsh fell in the 2011 Census, but surveys since then suggest the numbers are increasing. 2021 Census data to monitor the national milestone of one million Welsh speakers by 2050 will be published later in 2022.

Survey data suggests an increase in non-fluent Welsh speakers. The percentage of Welsh speakers that use the language every day has been fairly stable.

Conditions of listed buildings in Wales have improved slightly since 2015, but fewer recently assessed monuments are in a stable condition. Overall, 76% of listed buildings were in a stable or improving condition compared to 59% of monuments.

Arts, culture and heritage

The national indicator on arts, culture and heritage has been collected twice now, for the first time in 2017-18 and most recently in 2019-20. It shows a fall in the percentage of adults regularly attending or participating in arts, culture or heritage activities, from 75% in 2017-18 down to 71% in 2019-20.

There continue to be large differences in attendance and participation between groups. Younger adults, people in good health, people with higher qualifications or people living in the least deprived areas of Wales were more likely to attend or participate in these activities.

Image
Bar chart showing two years of data for the percentage of adults who regularly attend or take part in arts, culture or heritage activities. This fell from 75% in 2017-18 to 71% in 2019-20.

Arts attendance and participation in adults

Looking at the arts in more detail, the most recent National Survey for Wales shows that the pandemic has continued to have an impact on attendance at arts and cultural events. In 2021-22, 33% of people visited an arts event in the previous 12 months. This is substantially lower than in 2018-19 when the figure was 73%.

Seeing a film remains the most common arts activity. 21% of people say they saw a film at the cinema in 2021-22, down from 57% in 2018-19.

Participation in the arts increased throughout 2021-22 as restrictions eased but rates remained lower than prior to the pandemic. For 2021-22 overall, 14% of people participated in arts activities in the previous 12 months, compared to 20% when the data was last collected in 2018-19. Visual arts and crafts had the highest level of participation in 2021-22, with 8% of people taking part in the last year.

6% of people attended or participated in a Welsh language arts event in the last year.

The National Survey for Wales asked about barriers to going to or taking part in the arts. A lack of interest and difficulty finding time were the most common barriers mentioned, with 28% and 22% of people citing these reasons. However, for older adults, health reasons were reported as their biggest barrier.

Image
Bar chart showing reasons why people don't go to or take part in arts events. 28% of people say they are not interested and 22% that it's difficult to find the time. Other reasons are family commitments, cost, poor health and lack of access or facilities for disabled people.

Children and the arts

Over the long term, there has been an increase in children attending arts events. Children’s participation in the arts, however, has been more stable in recent years.

Data from the Arts Council of Wales shows that the share of children and young people attending arts events has increased over the last decade, although there was a slight decrease in the most recent year that data is available. It rose from 76.3% in 2010 to 86.7% in 2019. Data is not yet available for the period covering the pandemic.

Arts participation in children has been broadly unchanged over recent years. Around 86% to 87% of children and young people have taken part in the arts in each of the last four years up to 2019.

There are differences in attendance and participation according to gender and socio-economic background. Girls and children from higher social-economic backgrounds were more likely to attend and participate in the arts, although the gap between boys and girls narrowed in 2019.

Image
Line chart covering 2010 to 2019 showing the percentage of 7 to 18 year olds attending arts events once a year or more. The chart shows an increase between 2010 and 2019 from 76 per cent to 87 per cent, although there have been small falls in some years along the way.

Museums and archives

The accreditation scheme for museums and archives was paused for most of the pandemic, but the latest data shows that 99 museums met the accreditation standard in 2022, an increase of five since 2019. This means that 62% of museums are now accredited, compared to 59% in 2017 to 2019. Visits to museums during 2021-22 were affected by the pandemic, with data from the National Survey for Wales showing that 13% of people visited a museum in the last year compared with 37% in 2018-19.

There were 14 accredited archive services in 2022. Although the number meeting the accreditation standard has increased, the percentage has fallen from 86% in 2019 to 74% in 2022. This is due to a number of new entrants to the scheme who are yet to go to the accreditation panel.

Sport participation

The latest results from the National Survey for Wales show a mixed picture for sport participation. For the first time since 2017-18, there was a small increase in the share of adults who take part in sport regularly, although this change was not statistically significant. In 2021-22, 34% reported they take part in sport three or more times a week. Prior to this, the figure had been unchanged for the previous three years that data were available, standing at 32%.

Men, people aged 16 to 44 years old and people in employment were more likely to take part in sport three or more times a week. There were lower levels of participation among people in material deprivation and people with a long-term illness or condition. For ethnic groups, it is only possible to analyse the results for the categories White (Welsh, English, British etc), White other, and any other ethnic group. The White (Welsh, English, British etc) group had the lowest level of regular participation at 33%, although this was not significantly lower than rates for other ethnic groups.

Although there was an increase in people taking part in sport regularly, there was also an increase in people who do not take part in any sport or physical activity. 44% of adults reported this. This is the first time this figure has increased since the data began to be collected in the survey in 2016-17.

Overall, 31% of people would like to do more sport or physical activity. This has fallen substantially from previous surveys where around 50% said they would like to do more.

Image
Bar chart showing the percentage of adults participating in sport three or more times each week from 2016-17 to 2021-22. The result in 2021-22 was 34% a small increase from 32% recorded in the three previous years.

Children’s participation in sport

The latest school sport survey ran during 2022 with results due to be published in the autumn. The previous survey from 2018 showed that 48% of pupils in school years 3 to 11 participated in sports three times a week. This was unchanged from 2015, following a large increase from 2013.

There was very little difference in overall participation rates between primary and secondary schools, with 47% of primary pupils (aged 7 to 11) and 48% of secondary pupils (aged 11 to 16) participating three times a week in sports.

Boys were more likely to regularly participate in sport than girls (50% versus 46%), but the gap had narrowed compared to the previous survey in 2015. Participation rates for pupils from the least deprived schools tended to be higher than for pupils from the most deprived schools. Rates were also higher for pupils from a mixed or multiple ethnic group and for pupils who were fluent in Welsh.

Research by Sport Wales during the pandemic found that by August 2021 adults reported that their children were doing more sport or physical activity outside of school hours than they typically would have before the pandemic.

Image
Bar chart showing the percentage of children participating in sport three or more times a week in 2013, 2015 and 2018. In 2015 and 2018 the figure was 48 per cent.

Welsh speakers

The census is the main source of information on the number of people who can speak Welsh in Wales. Data from the 2021 Census will be published later in 2022. According to the previous census in 2011, 19% of people aged three or older are able to speak Welsh.

The national milestone on Welsh language is for one million Welsh speakers by 2050. The data from the census shows that just over 562,000 people in Wales spoke Welsh in 2011. In 1911, almost one million people spoke Welsh so the number has fallen considerably over the last century. It has rebounded slightly since its lowest point in 1981.

Because the census only happens once a decade we use surveys to look at trends between censuses. Survey data are not comparable with the census as people are usually more likely to report they are able to speak Welsh in surveys.

Survey data since the 2011 Census suggests that the number of Welsh speakers has increased, although the share who are fluent has remained relatively unchanged. This means that the increase in the number of Welsh speakers is mainly from people who are not fluent. The percentage of people who are fluent in Welsh has remained at around 10% to 11% since 2012-13, according to the National Survey for Wales.

The percentage of people able to speak Welsh but not fluently is 24%. This has been increasing over recent years, despite a one-off fall in 2019-20 where it fell to 13%.

Another source of data on Welsh speakers is the Annual Population Survey. This survey also shows an increase in the percentage of people able to speak Welsh over the last decade. The survey switched from face-to-face interviews to telephone during the pandemic and the impact of this on the statistics isn’t yet fully understood. Previous research suggests that some survey methods can result in more people reporting they are able to speak Welsh than other survey methods.

Image
Stacked bar chart showing Welsh speaking ability from 2012-13 to 2021-22 (no data available for 2015-16). The percentage of people with at least some Welsh speaking ability has grown over time and now stands at 36%. The percentage of people fluent in Welsh has remained stable at around 11%.

Welsh language use

The latest Welsh language use survey shows there has been little change in how often people speak Welsh.

In 2019-20, 10% of people aged three or older spoke Welsh daily and could speak more than just a few words of Welsh. This is the same percentage as in the previous Welsh Language Use Survey in 2013-15. More recent data from the National Survey for Wales for people aged 16 or older also suggests there has been little overall change in the rate of people using Welsh daily.

Children and young people are the group most likely to report they are able to speak Welsh according to both the census and surveys, with both sources suggesting around 40% of 3 to 15 year olds are able to do so. Younger people beyond the age of compulsory education are less likely to report that they speak Welsh.

The Welsh Language Use Survey provides analysis of the use of Welsh language amongst children and adults. It showed that children are most likely to use Welsh daily, likely due to regular use in schools. The percentage of 3 to 15 year olds who spoke Welsh daily was considerably higher than any other age group, with almost a quarter of them speaking Welsh daily. The percentage of 3 to 15 year olds who spoke Welsh daily is similar to the percentage of pupils who receive their education in Welsh-medium or bilingual primary, middle and secondary schools, although we do not know if they are necessarily the same children.

Children aged 3 to 15 are much more likely to have started learning to speak the language at school than those aged 65 or older (69% compared to 15%). This is probably due to the significant change in the Welsh-medium education sector over the last fifty years, with a general increase in the number of pupils learning through the medium of Welsh and in the number of Welsh-medium schools that have been opened across Wales.

The youngest age group are less likely to have at least one parent who is fluent in Welsh. 36% of children aged 3 to 15 reported this, compared to 69% for people aged 65 or older.

The Welsh language use survey 2019-20 shows that Welsh speakers who started learning to speak the language at home as young children are much more likely to speak the language daily or be fluent in Welsh compared with those who started learning to speak Welsh at school or as an adult elsewhere.

The Welsh language use survey also concluded that Welsh speakers are twice as likely to speak Welsh every day if they had at least one parent fluent in Welsh, compared to Welsh speakers who did not have a fluent parent.

Fluent Welsh speakers speak the language more often than those who are not fluent.

Historic buildings and monuments

Conditions of listed buildings in Wales have improved slightly since 2015, but fewer recently assessed monuments are in a stable condition.

Of the 30,000 listed buildings, 76% are in a stable or improving condition and 9% are considered to be at risk. In general, conditions of listed buildings have improved slightly since 2015, when 74% were in a stable or improving condition 

The conditions of a sample of scheduled monuments are assessed each year. In 2021-22 condition surveys were carried out for 444 scheduled monuments, of which 50% were found to be stable or improved and 50% worsened. 16% of the monuments were considered to be at risk. Generally, monuments assessed this year were more likely to be in a worsening condition or at risk than those assessed to date.  

Of the 4,200 scheduled monuments in Wales, overall 59% are assessed to be in a stable or improved condition. This is unchanged from last year, but over the longer term the figure has been gradually falling since 2016-17, when 66% were in a stable or improved condition. In line with the findings from the previous year, 41% of scheduled monuments are demonstrating deterioration, of which 15% are considered to be ‘at risk’. The main impacts are damage and decay due to weathering and stock erosion.  

According to the National Survey for Wales in 2019-20, 63% of adults visited a historic place in the previous year, with castles, forts and ruins the most likely place to be visited. There has been no overall change in the share of people visiting historic places since the data was last collected in 2017-18.

Image
Line chart showing the percentage of scheduled monuments that are in a stable or improving condition. It increases from 62% in 2011-12 to a high of 66% in 2016-17. It then falls to 59% in 2020-21.

Further reading

Previous versions of the Wellbeing of Wales report include further analysis of:

  • taking part in volunteering or in arts or sports activities
  • barriers to participation in arts differences between socio-economic and population groups in arts and sports participation
  • trends in the types of activities participated
  • sport participation during the pandemic
  • links between Welsh language and arts and culture events

The Arts Council of Wales and Sport Wales produce regular in-depth reports on arts and sports. This includes the Children’s Omnibus Survey 2019 and the School Sport Survey. Results from the latest School Sport Survey are expected later in 2022.
A range of analysis on the Welsh Language is also available from the 2011 Census and in Welsh Language Use Survey reports for 2019-20.

The following publications analysed survey data on the Welsh Language in more detail.

Speaking Welsh (National Survey for Wales): April 2018 to March 2019

Where and when people learn to speak Welsh (National Survey for Wales): April 2018 to March 2019

Welsh language data from the Annual Population Survey: 2001 to 2018

Data sources

A globally responsible Wales

The goal for a globally responsible Wales

Author: Stefanie Taylor

A nation which, when doing anything to improve the economic, social, environmental and cultural wellbeing of Wales, takes account of whether doing such a thing may make a positive contribution to global wellbeing. This goal recognises that in an inter-connected world what we do to make Wales a sustainable nation can have positive and adverse impacts outside of Wales.

What have we learnt from the data in the last year?

In 2020, it was estimated that greenhouse gas emissions totalled 33.6 million tonnes of carbon dioxide (CO2) equivalent.

In 2021, there were 479 referrals of potential victims of slavery received by police forces in Wales. This is a 25% increase compared to 2020 (384 referrals). Some of the increase in recent years is probably due to improved reporting.

The Forced Marriage Unit gave advice or support in 8 cases related to a possible forced marriage and/or possible female genital mutilation in 2021 in Wales, which made up 2% of the UK total.

The National Survey for Wales reported 11% of adult have done three or more of the four following actions to help with global issues: donating or raising money, campaigning, volunteering, or changing what they buy.

In 2021/22, there were 23,888 entrants for the Global Citizenship Challenge at key stage 4, and 11,504 at advanced level who chose the global citizenship challenge component.

The proportion of children who were up to date with their routine immunisations by four years of age was 87.0% for the year ending March 2022.

Uptake of both the ‘6 in 1’ and pneumococcal conjugate vaccinations remained above 95% in children at one year of age for the fourteenth consecutive year.

MMR uptake was just below 95% for the first dose at two years.

There was a slight fall in the number of asylum seekers receiving support at the end of March 2022. Figures have decreased since the same quarter in 2020.

As at the end of March 2022, a total of 1,437 refugees have been resettled in Wales under the Vulnerable Persons Resettlement Scheme (2016-2022) and UK Resettlement Scheme (2021 onwards).

In 2020/21, there were 21,570 enrolments for higher education institutions in Wales from international students from over 180 countries, comprising 16.6% of all enrolments.

What is the longer term progress towards the goal?

Data for some of the national indicators suggest that progress is being made towards the globally responsible Wales goal. These include long-term improvements to reductions in greenhouse gas emissions and other national indicators which overlap with the resilient Wales goal. There is a national milestone for greenhouse gases which is for Wales to achieve net-zero greenhouse gas emissions by 2050.

There is also a national milestone relating to global footprint which is for Wales to use only its fair share of the world’s resources by 2050. The global footprint of Wales, an indicator of the total environmental burden that a society places on the planet, is roughly equivalent to five times the size of Wales. A recalculation of the global footprint is currently being commissioned and will be available in 2023

Data is available for the global active citizenship indicator for the first time this year.

Global context, United Nations Sustainable Development Goals

On 1 January 2016, the world began implementation of the 2030 Agenda for Sustainable Development, the transformative plan of action based on 17 Sustainable Development Goals (SDGs), to address urgent global challenges over the next 15 years. The SDGs emphasise a universal agenda that requires all UN member states, both rich and poor alike, to take action to support sustainable development.

There are many factors which dictate whether Wales is becoming a more globally responsible nation.

The Well-being of Future Generations Act, with its Welsh specific well-being goals, provides a framework for Wales’ contribution to the achievement of the United Nations Sustainable Development Goals. For the most part the other six narrative reports, through their assessment of our progress towards the national well-being goals, demonstrate our overall contribution as a nation to the international sustainable development agenda. For example, we report elsewhere on national trends on issues such as poverty, inequalities and decent work. This narrative on a globally responsible Wales therefore focuses on areas that are most relevant to the global agenda in particular.

The 50 national indicators for Wales have also been mapped for indicative purposes against the 17 Sustainable Development Goals to help you navigate between progress here in Wales, and the relationship to each of the SDGs.

National Indicators: mapping to Well-being and UN Sustainable Development Goals (interactive tool)

Whilst some of the narrative is drawn from national indicators and official statistics, some of the data presented in this section is contextual and uses data or factual statements related to specific policies or programmes, where we have considered it relevant to the overall narrative. These data are not collected through official statistics sources, and although reported here for context, we cannot provide full assurance about data quality. However, where possible, more information about the data can be found in the Quality report for National Wellbeing Indicators and the non-indicator quality report.

Climate change

People in Wales are concerned about climate change.

In May 2020, due to the COVID-19 (coronavirus) pandemic the National Survey changed mode from a face-to-face interview to one over the telephone. The wording of some questions was also changed to better suit the mode. For these reasons it is not always possible to make direct comparisons across years but, where relevant, results from previous years are included to add context.

The National Survey results for 2021-22 show that the vast majority (97%) of people in Wales think the world’s climate is changing. In 2021-22, 76% of adults were fairly concerned or very concerned about climate change, unchanged from the results in 2020-21 (76%) and in 2018-19 (76%) and an increase compared with the 67% in 2016-17.

In 2021-22, 56% of people think that climate change is mainly or entirely due to human activity. 94% think human activity is involved to some extent in the world’s climate changing.

Greenhouse gas emissions

Greenhouse gas emissions have reduced since the 1990s, despite some periods of increases.

Goal 13 of the UN SDGs is to “take urgent action to combat climate change and its impacts”. There is a national milestone for greenhouse gases which is for Wales to achieve net-zero greenhouse gas emissions by 2050.

In 2020, it was estimated that emissions totalled 33.6 million tonnes of carbon dioxide (CO2) equivalent, a fall of 39.2% since the base year (1990). This decrease was driven by efficiencies in energy generation and business sector heating, the use of natural gas to replace some coal and other fuels as well as abatement in some chemical industries. Variations in manufacturing output (for example, in iron and steel, bulk chemical production) have also had a significant impact on the trend.

There was a 11.6% decrease in greenhouse gas emissions in 2020 compared with 2019. Most of this decrease is due to a combination of reduced emissions in the energy supply sector and a reduction in emissions across many sectors as a consequence of the coronavirus (COVID-19) pandemic and the resulting restrictions introduced in 2020.

The largest source of emissions comes from the business sector, which produces 26% of all greenhouse gas emissions in Wales. This sector is dominated by the combustion of fossil fuels in industrial production, primarily from the iron and steel production.

The energy supply sector is the second largest source making up 25% of Welsh emissions. This is followed by the agriculture sector (15%), the transport sector (14%), the residential sector (11%), with other sectors each making smaller contributions of 5% or less.

Annual figures on greenhouse gas emissions only take account of emissions within Wales. They do not include emissions resulting from goods and services consumed in Wales, where they are produced elsewhere (also known as the carbon footprint). Estimates on this wider basis will be published in December 2022 as part of statutory progress report on the carbon budget.

Image
Line chart to show the volume of greenhouse gas emissions (kilotonnes) in Wales in between 1990 and 2020. Emissions in Wales have fallen by almost 40 per cent since the base year.

Global footprint

There is a national milestone relating to the global footprint which is for Wales to use only its fair share of the world’s resources by 2050.

In December 2021 the ecological footprint indicator changed name to global footprint to more accurately reflect how it is referred to internationally and the cross-cutting nature of what is measured. An update and recalculation of the global footprint will be available in 2023. In addition to the footprint itself, this work will include additional metrics to help better understand some of the more important components of our global impacts, including a material footprint and the proportion of the global footprint associated with waste. We will also be assessing the global impacts of Welsh consumption on biodiversity, as well as some work to better align this with other consumption-based metrics such as carbon for reporting.

Based on the most recent calculation, the global footprint of Wales in 2015 is roughly equivalent to five times the size of Wales. This is an indicator of the total environmental burden that a society places on the planet.

Active global citizenship

The National Survey for Wales, for the first time, asked people about what activities they had done to help with international issues such as poverty, human rights, war, refugees or climate change. These questions were asked prior to the war in Ukraine.

11% of those surveyed have done three or more of the four following actions to help with global issues: donating or raising money, campaigning, volunteering, or changing what they buy.

31% of people say they have donated money in the preceding three months to help with global issues. The most common issues people donated money for were international poverty (21%) and to support refugees (15%). 36% of women say they gave money, compared with 26% of men.

17% of people say they have campaigned for international issues in last 12 months to help with global issues and 5% say they have volunteered. 11% of people campaigned for human rights issues and 10% against climate change, while 2% volunteered to stop poverty and 2% to help refugees.

54% say they have changed what they buy because of global issues. People aged under 75 are more likely to have changed what they buy (57%) than people aged 75 and over (34%). People aged 25 to 44 were the group most likely to have made changes to what they buy (63%).

Modern slavery

Referrals of potential victims of modern slavery in Wales continue to have increased in recent years.

The UN SDGs include a target on ‘Ending modern slavery and human trafficking’. Modern slavery is the term used within the UK and is defined within the Modern Slavery Act 2015. The Act categorises offences of Slavery, Servitude and Forced or Compulsory Labour and Human Trafficking.

According to the National Crime Agency (NCA), the recorded incidents of potential victims of slavery to the National Referral Mechanism (NRM) or via the Duty to Notify (DtN) process continue to increase each year in Wales.

In 2021, there were 479 referrals of potential victims of slavery received by police forces in Wales. This is a 25% increase compared to 2020 (384 referrals). 2020 was the first year that the NCA has seen referrals not increase in the UK compared to the preceding year, which is primarily thought to result from the COVID-19 pandemic and associated restrictions.

Some increases in recent years are probably due to improved reporting and changes in how the data are recorded. In 2021 116 of the referrals were for females (24%) and 363 were for males (76%).

There were 166 (35%) individuals referred for adult exploitation categories and 291 (61%) referred for exploitation as a minor, 22 (5%) were not specified or unknown.

The most common type of exploitation for adults was labour closely followed by criminal, and for minors it was criminal exploitation.

Forced marriage and female genital mutilation

Forced marriage or possible female genital mutilation is being identified in Wales

Goal 5 of the UN SDGs include a target to ‘eliminate all harmful practices, such as child, early and forced marriage and female genital mutilation’.

According to the Foreign, Commonwealth & Development Office, the Forced Marriage Unit (FMU) gave advice or support in 8 cases related to a possible forced marriage and/or possible female genital mutilation in 2021 in Wales, which made up 2% of the UK total. This is a decrease from 15 cases (2% of the UK total) in 2020.

Due to low numbers relative to some other parts of the UK the trend for Wales has been volatile between 2015 and 2021. In addition, lower numbers this year may be attributable to reasons derived from the pandemic, such as restrictions on weddings and travel. Following the introduction of the first lockdown, referrals to the FMU decreased. A procedural change regarding whether to log a new case as a referral or a general enquiry is also likely to have had a minor impact on the overall number of cases compared with previous years and so direct comparisons should be treated with caution.

Image
Line chart showing The Forced Marriage Unit (FMU) gave advice or support in 8 cases related to a possible forced marriage and/or possible female genital mutilation (FGM) in 2021 in Wales. This is a decrease from 15 cases in 2020. Due to low numbers relative to some other parts of the UK the trend for Wales has been volatile between 2015-2021.

Global citizenship education

Young people in Wales are learning about global issues but there’s been a decline in recent years in international students attending higher education institutions in Wales.

The UN SDG ‘Quality Education’ recognises the importance of obtaining a quality education and all learners acquiring the knowledge and skills needed to promote sustainable development, including sustainable lifestyles, human rights, gender equality and global citizenship.

Up until 2020/21, within the Welsh Baccalaureate Skills Challenge Certificate there was a compulsory Global Citizenship component, which engages students in learning about global issues. Since 2020/21 the Global Citizenship component has been non-compulsory, therefore any comparisons prior to 2020/21 would need to be taken with care.

In 2021/22, there were 32,535 entrants for the Global Citizenship Challenge at key stage 4, and 20,338 at advanced level who chose the global citizenship challenge component. For key stage 4, 99.1% of entries achieved a level 1 pass or above, and at the advanced level, 99.3% achieved a level 3 pass or above.

International students

A large number of students from a range of countries attend higher education institutions in Wales.

In 2020/21, there were 21,565 enrolments from international students for Higher Education providers in Wales, comprising 17% of all enrolments. Of these, 5,395 were from students of European Union domicile (4% of all enrolments), while 16,170 were from students of non-European Union domicile (12% of all enrolments). At its peak in 2010/11, there were 26,290 enrolments in Higher Education institutions in Wales from international students, which made up 20% of the student population.

Image
Line chart showing the percentage of the student population at Welsh higher education institutions who are international students, from 2007/08 to 2020/21. In 2020/21 there were 21,565 international students. This is similar to the figures for the last 5 years but lower than the peak in 2010/11, when there were 26,290 international students in Wales.

Food poverty

Some adults in Wales are facing food poverty and are concerned about affording food.

The UN SDG ‘Zero Hunger’ aims to end hunger and achieve food security and improve nutrition.

The 2021-22 National Survey for Wales reported that 2% of households had received food from a food bank in the last 12 months with a further 1% saying they hadn’t but had wanted to. It is difficult to make direct comparison with previous years due to changes in the wording of the question and in how it was asked.

The survey also reported 4% of adults said there was at least one day in the previous fortnight where they had gone without a substantial meal. This was lower than 9% reported in 2018-19 and similar to 2020-21 and 2017-18 (4%). However, the results across years are not directly comparable due to changes in wording and in how the question was asked.

Asylum seekers

The number of asylum seekers receiving support has remained steady in the past few years but has increased since the start of the decade.
Goal 16 of the UN SDGs is to ‘promote peaceful and inclusive societies for sustainable development, provide access to justice for all and build effective, accountable and inclusive institutions at all levels’.

Complete figures for the numbers of asylum seekers and refugees who are resettled in Wales are not available. However, figures are published relating to the number of refugees resettled under the UK Resettlement Scheme (and formerly the Vulnerable Persons Resettlement Scheme), and the number of those currently receiving asylum support.

As at the end of March 2022, a total of 1,437 refugees have been resettled in Wales under the Vulnerable Persons Resettlement Scheme (2016-2022) and UK Resettlement Scheme (2021 onwards).

Section 95 provides support for asylum seekers who have an asylum claim or appeal outstanding and failed asylum seekers who had children in their household when their appeal rights were exhausted, and includes those in receipt of:

a) dispersed accommodation: those in receipt of accommodation only, or both accommodation and subsistence
b) subsistence only: whereby the applicant receives cash to support themselves but who have found their own accommodation

At the end of March 2022, more than 2,300 asylum seekers were receiving support in Wales. The numbers receiving support have fallen since the same quarter in 2020, having remained stable between 2016 and 2020.

Image
Line chart showing the number of asylum seekers in receipt of Section 95 support, year ending March 2004 to year ending March 2022. The number of asylum seekers receiving support has remained steady in the past few years 2016-2020, but has decreased each year since 2020.

In 2022 the war in Ukraine caused many people to flee the conflict. As at the end of August 2022, over 8,000 visas have been issued to people from Ukraine with a sponsor in Wales. The Welsh Government provided a “super sponsor” role to over 4,500 of these. Over 5,300 people with sponsors in Wales had arrived in the UK by the end of August 2022.  

Vaccination coverage

Vaccination uptake in young children continues to be high, but has decreased slightly since its highest levels.

The UN SDG Sustainable Development goal ‘Good Health and Well-being’ states the importance of providing access to affordable and essential medicines and vaccines. The World Health Organisation has a vision for a world without measles, rubella and congenital rubella syndrome (CRS).

The majority of children for the April 2021 to March 2022 year would have been due their immunisations during the COVID-19 pandemic. Although coverage for younger children who receive their immunisations in general practice remains positive, there has been a slight decreasing trend over the previous four quarters. Uptake of the ‘6 in 1’ vaccine (all three doses) in children reaching their first birthday was 95.2%, compared to 95.6% in the previous year.

Uptake of both the ‘6 in 1’ and pneumococcal conjugate vaccinations remained above 95% in children at one year of age for the fourteenth consecutive year.

MMR uptake was just below 95% for the first dose at two years. This is suboptimal for preventing outbreaks of measles (target uptake is 95%).

The proportion of children who were up to date with their routine immunisations by four years of age was 87% this year. The reported inequality gap in immunisation coverage between four year olds residing in the most and least deprived areas was 8.5 percentage points, the same as 2020-21. However, further work is needed to identify the root cause of these inequalities and identify interventions to reduce this gap.

Image
"Line chart showing percentage uptake of MMR and the 6 in 1 vaccine from 2008-09 to 2020-21. Uptake of both the ‘6 in 1’ and pneumococcal conjugate vaccinations remained above 95 per cent in children at one year of age for the thirteenth consecutive year. MMR uptake was just below 95 per cent for the first dose at two years and although it has increased since 2008-09, it is lower than the peak in 2013-14 "

The most recent stage of the COVID-19 vaccination programme was the roll out of the 2022 spring booster for all people 75 years of age and older, the severely immunosuppressed and older adults resident in a care home. Uptake was higher in the Combined White ethnic groups compared to the combined Black, Asian, Mixed and Other ethnic groups. This was the case in all of the groups eligible for the spring booster. Uptake was also higher in those residing in the least deprived areas, compared to those living in the most deprived areas.

Physical punishment of children

The physical punishment of children became illegal in Wales on March 21, 2022. The results presented here were collected from July 2021 to January 2022, before this law came into effect.

Parents and non-parents were asked about their views on smacking children and whether they agreed or disagreed that it was sometimes necessary.

There has been a shift in attitudes since this question was asked in 2019-20. In 2019-20 35% of people said it was sometimes necessary to smack a child compared with 25% now. The proportion who strongly disagree that smacking is sometimes necessary has risen to 40%, up from 30% in 2019-20.

32% of men and 20% of women say that it is sometimes necessary to smack a child. 84% of people aged 16 to 24 say that smacking is never necessary compared with 42% of people aged 75 and over.

Image
Bar chart showing National Survey responses for the 2019-20 survey and the 2021-22 online trial about whether respondents agree smacking is sometimes necessary. In 2019-20 35% of people said it was sometimes necessary to smack a child compared with 25% now. The proportion who strongly disagree that smacking is sometimes necessary has risen to 40% (from 30% in 2019-20).

World heritage sites

The UN SDG ‘Sustainable Cities and Communities’ states the importance of protecting and safeguarding the world’s natural heritage.

World Heritage Sites are places of Outstanding Universal Value to the whole of humanity. This means that their cultural and/or natural significance is so exceptional that it has special importance for people everywhere, now and in the future.

In 2021 the Slate Landscape of Northwest Wales was added to the UNESCO’s World Heritage List, becoming the fourth in Wales.

This joined Blaenavon Industrial Landscape in south-east Wales, Pontcysyllte Aqueduct and Canal in north-east Wales and the Castles and Town Walls of Edward I in Gwynedd at Caernarfon, Conwy, Beaumaris and Harlech in north-west Wales.

Further reading

Data sources

Background information

What is this report?

This report provides an update on progress being made in Wales towards the achievement of the 7 wellbeing goals. It is a statutory report required under the Well-being of Future Generations (Wales) Act 2015. It is a report concerning the collective progress of Wales as a nation. It is not a report on the performance of an individual organisation. The first report was published in September 2017.

This year we have published a supplementary children and young people report. This report contains supplementary analysis of the data contained in the Well-being of Wales report that relates to children and young people

The Well-being of Future Generations (Wales) Act 2015

The Well-being of Future Generations (Wales) Act is about improving the social, economic, environmental and cultural wellbeing of Wales. It is intended to make the public bodies listed in the Act think more about the long-term, work better with people and communities and each other, look to prevent problems and take a more joined-up approach. This in turn is intended to create a Wales that we all want to live in, now and in the future.

The Act also puts in place 7 wellbeing goals for a prosperous, healthier, resilient, more equal and globally responsible Wales, with cohesive communities and a vibrant culture and thriving welsh language.

For more background information on the Act please see the Essentials guide.

What are the national indicators for Wales?

The Act required Welsh Ministers to set national indicators to assess progress towards achieving the wellbeing goals. From September 2015 to January 2016 Welsh Government undertook a widespread public consultation to identify what small set of indicators should be developed to best measure progress against the wellbeing goals. These national indicators were published in March 2016 and laid before the National Assembly for Wales.

In 2021, Welsh Government asked for views on possible new indicators based on the learning from COVID-19. Based on these responses and wider input, some indicators have been updated and 4 new national indicators have been included and the indicator set was updated in December 2021.

The national indicators are designed to represent the outcomes for Wales, and its people that will help demonstrate progress towards the 7 wellbeing goals. They are not intended to be performance indicators for an individual organisation.

Full description of the national indicators including their technical definition and information about their data sources and frequency can be found in the technical document.

How does this relate to the UN Sustainable Development Goals?

The 2030 Agenda for Sustainable Development is a transformative plan of action based on 17 United Nations Sustainable Development Goals to address urgent global challenges over the next 15 years. The United Nations’ 17 global goals mean that every country on the planet will have to take action to end poverty, promote prosperity and wellbeing for all, protect the environment, and address climate change. Those goals are meant to be far-reaching, people-centred, universal and transformative. UN member states have committed to working tirelessly towards their implementation by 2030, and Wales will play its part.

Many national indicators will help tell a story of progress in Wales against more than one of the United Nations Sustainable Development Goals. We have mapped the indicators against the goals.

What are the national milestones?

As well as setting national indicators, the Act also requires Welsh Ministers to set national milestones to assist in measuring whether progress is being made at a national level towards the achievement of the wellbeing goals. Following development and consultation throughout 2021, the first wave of national milestones were laid before the Senedd in December 2021.

Who produced this report?

The report has been produced by Welsh Government statisticians under the responsibility of the Welsh Government’s Chief Statistician. It has been produced in line with the Code of Practice for Statistics and is therefore produced independently of political influence.

Timeliness

The report has been published in September to ensure it is as close as possible to the end of the preceding financial year, but after the publication of the National Survey for Wales which is the source for 13 of the national indicators

The data for the national indicators will be kept up to date as new datasets are published for those indicators.

Coverage

This report covers a wide range of subjects, and therefore in this report it is only possible to consider high level measures of progress. More in depth analysis of many of these topics are available through the range of statistical releases published by Welsh Government, the ONS or other statistical producers.

The coverage of the report is Wales. For some indicators, reference is made to the position relative to the UK. The narrative against the goals and for each indicator is based on national progress against the goals, and it does not seek to provide a report on progress at different geographical levels. However, data for many indicators are available on StatsWales, or on request, at lower levels of geographical detail.

Accessibility

This report has been produced as an online report to improve the accessibility, responsiveness and user experience.

The majority of the data underlying the report, including much more detailed breakdowns, are available on StatsWales and through the StatsWales open data services.

Are all the data official statistics?

This year the Wellbeing of Wales report has been given National Statistics status. This means it has been independently assessed as meeting the highest standards of trustworthiness, quality and value.

Most of the indicators (36) are based on sources that have been published as official statistics. That is, they have been published by government statisticians, or by other public bodies, under the Code of Practice for Statistics.

28 of these indicators are based on sources that have been published as National Statistics. That is the UK Statistics Authority has designated these statistics as National Statistics, signifying compliance with the Code of Practice for Statistics. This means that they meet the highest standards of trustworthiness, quality and public value.

12 indicators are based on other sources such as administrative data held by government departments. 2 indicators currently have no data.

Although not all of the data sources used are from official statistics, the report itself has been developed and published in accordance with the Code of Practice for Statistics.

What else should I know about the data?

The quality report for national indicators reports alongside this release provides links to quality information about each of the data sources used to measure the national indicators, or provides that information where it does not exist elsewhere.

Whilst most of the narrative in the Wellbeing of Wales report is drawn from national indicators, some of the contextual data is from other official statistics or other statistics and evidence where we have considered it relevant to the overall narrative. The data not collected through official statistics sources are used in the Wellbeing of Wales report for context, but we cannot always provide assurance about data quality. As the data in the progress report have been sourced from a variety of datasets, the level of quality information available will differ in each case. We have provided links to the original sources and their quality information where they exist.

Who are the users of this report?

It is anticipated this report will be used by Welsh Government; the Senedd (including Members of the Senedd and its committees); the media; and the general public to help understand (i) the Wellbeing of Wales (ii) progress being made against the 7 wellbeing goals and (iii) where Wales is making progress against the United Nations Sustainable Development Goals.

The national indicators and milestones can help public bodies who are subject to the future generations law understand further the nature of the change expected in achieving the wellbeing goals. The national indicators should be considered as useful evidence to assist public bodies in understanding the main areas where progress should be made in relation to the wellbeing goals.

The national indicators will also have a specific role as they must be referred to by public services boards in Wales when they are analysing the state of economic, social, environmental, and cultural wellbeing in their areas. The report should also be used by public bodies to develop and review wellbeing assessments and to set and review wellbeing objectives required under the Well-being of Future Generations (Wales) Act.

The annual Wellbeing of Wales report must also be taken into account by the Future Generations Commissioner for Wales when they prepare and publish their ‘Future Generations Report’.

UK context

For the UK as a whole, the Office for National Statistics has a National Well-being Programme. The well-being dashboard (Office for National Statistics) provides a visual overview of 43 headline national wellbeing indicators and can be explored by the 10 areas of life (domains) or by the direction of change.

In Scotland, the National Performance Framework (NPF) sets out a vision for national wellbeing and measures achievement in relation to this. A revised NPF was launched in June 2018 following an open review process and is underpinned by statute (the Community Empowerment (Scotland) Act 2015).

The revised NPF maps its eleven National Outcomes to the seventeen UN Sustainable Development Goals (SDGs) and forms an important part of Scotland’s localisation of the SDG agenda. Progress towards the vision set out in the NPF is reported on in an open and transparent way on the National Performance Framework website through 81 national indicators covering a broad range of social, economic and environmental measures. In additional to showing performance at the national level the data can be explored by a range of demographic and geographic subgroups to see whether outcomes are being realised for different parts of Scottish society.

In Northern Ireland, the principal mechanism for assessing societal wellbeing is the wellbeing framework of 12 outcomes that was developed by the previous Executive, consulted on and refined during 2016-2017. This framework, which contains 49 supporting population indicators, overarches the Northern Ireland Civil Service Outcomes Delivery Plan.

Northern Ireland Statistics and Research Agency continues to participate in the ONS-led Measuring National Well-being programme and publish a wellbeing analysis (Northern Ireland Statistics and Research Agency) based on the ONS wellbeing measures, where Northern Ireland data availability allows.

Other related links